We often get asked if Investar can help in finding profit targets and stop losses, and the answer is a resounding yes! This post explains a very simple technique used to set profit targets (with a real example). It uses resistance levels to set profit targets.
One of the very basic technique in Technical Analysis is Support/Resistance Analysis. This involves finding support and resistance levels in a price chart based on past price history (If you don’t know what support and resistance are, here is a video explaining the basics). The whole premise of using support/resistance levels in your trading is the concept of the reversal of support and resistance levels. Putting this in plain English, this means:
- A previous support level when defeated turns into resistance, and vice versa,
- A previous resistance level once defeated turns into support.
This concept is extremely powerful and gives us the real predictive power in Technical Analysis because once we know past support/resistance levels we can predict the future support and resistance levels based on past levels.
But, how do you use this to set profit targets?
A simple technique is to use the future resistance levels as profit targets. A resistance is a price level where a stock price will hit a ceiling and reverse. In other words, a stock has a greater chance of reversing at a resistance level. So, all we need to do to identify price targets is to identify future resistance levels in a price chart. Here is an example of a stock, IBPOW, that broke out of a strong resistance and gave a nice profit of 40+% within a few days (We posted about this when it broke out on 15th Feb on our Facebook Page (See the 15 Feb, 2012 post)).
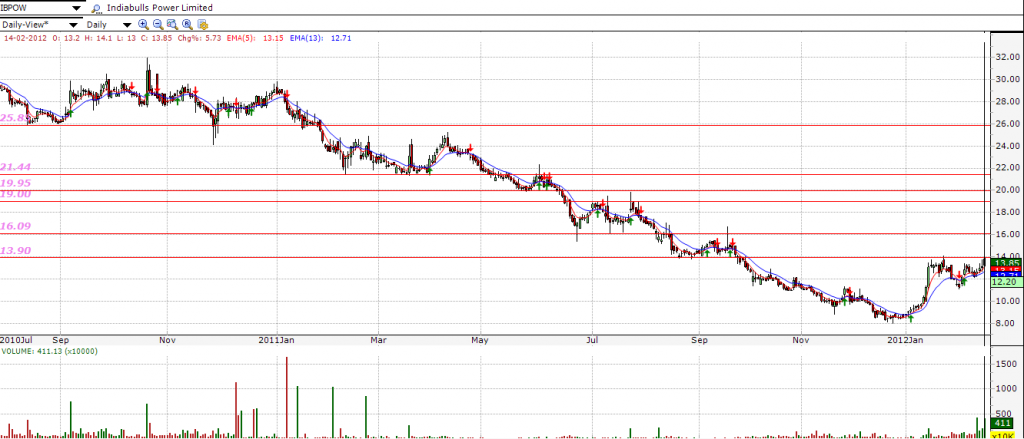
Here is a screenshot of IBPOW taken right before its breakout on 15th Feb, 2012:
What we have done is use the “Horizontal Line” tool to draw various lines through peaks and troughs in the price chart that identify the various support/resistance levels. Assuming that we bought IBPOW within 2% of the breakout level of 13.90, our profit targets can be set to the resistance levels of 16.09, 19.00 and 19.95.
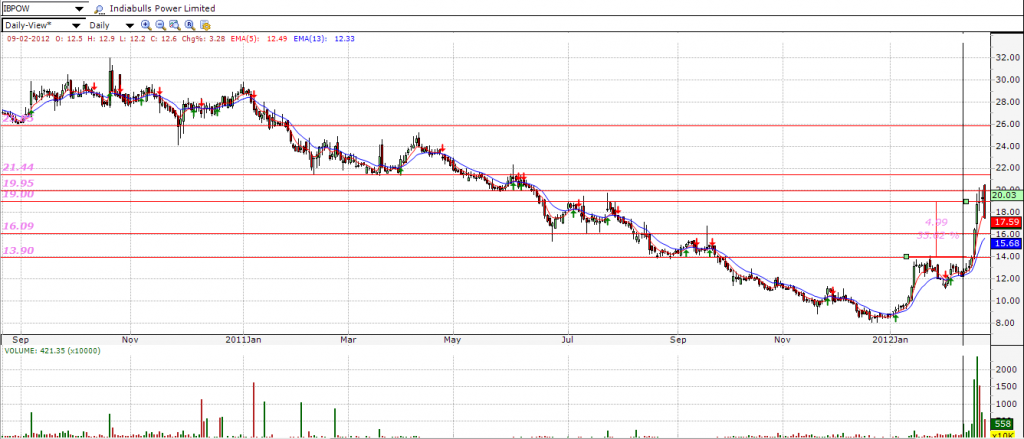
What happened in this stock is that the volume and price momentum was so huge, that the price target was achieved on 15th Feb itself (see the chart below)!
Now, its perfectly okay to sell at 16.09 if you are happy with a gain of 14%, but with such huge volume, we would rather bet on a 19 or 20 price target ( the next resistance levels). In this case, assuming that we sold it at 19 when the stock reversed and hit our stop loss, it gave a gain of almost 35% in a short span of 5 days which is a pretty phenomenal gain by all means ( for your reference, the world’s best investor, Warren Buffett, has a return of 29% per annum)!
Note: Most professional traders don’t sell based on limit orders; rather they take the approach of raising their stop losses as the stock keeps breaching the price targets, in other words, once you have breached the 16 level, you want to put a stop loss slightly below 16 (because 16 is a new resistance-turned support). This way one can maximize the profits just in case the stock keeps running higher, which in this case it did.
If you are wondering if the support/resistance levels that we have drawn here can be drawn automatically by the software, please understand that computers are not as good at recognizing the peaks and troughs that are needed to draw these support/resistance lines perfectly and although some software may claim to give you automatic support/resistance levels, they are really theoretical levels based on fibonacci or pivot levels that are not necessarily so accurate. And hence the most accurate targets can be derived by drawing these support/resistance levels yourself using the drawing tools in the software.
As you might have rightly guessed, you need to be able to predict the support/resistance levels properly in order to set proper profit targets! In fact, mastering Support/Resistance Analysis is extremely important if you want to be a good Technical Analyst because it is indispensable for not only setting profit targets, but also exact entry and exit points, setting stop losses, etc. So much so, that we feel that you should not enter the market without doing proper Support/Resistance Analysis and Trend Analysis of Nifty or Sensex. If you need help in perfecting the art of drawing support/resistance levels, you should consider attending our live webinar, “Basics of Technical Analysis”, where we go through these aspects in great detail in a live interactive setting.


Really helpful to beginners
Very good article of Profit targets
Full time futures Trader
Please Connect me on Linkedin vbsreddy7@gmail.com
good work