The accumulation/distribution line or accumulation/distribution index (ADL), formulated by Marc Chaikin is a technical analysis indicator meant to relate price and volume in the stock market and also works like a leading indicator of price movements.
Actually, this indicator is a variant of the more widely used indicator On Balance Volume. They are both used to confirm price changes by way of calculating the respective volume of sales.
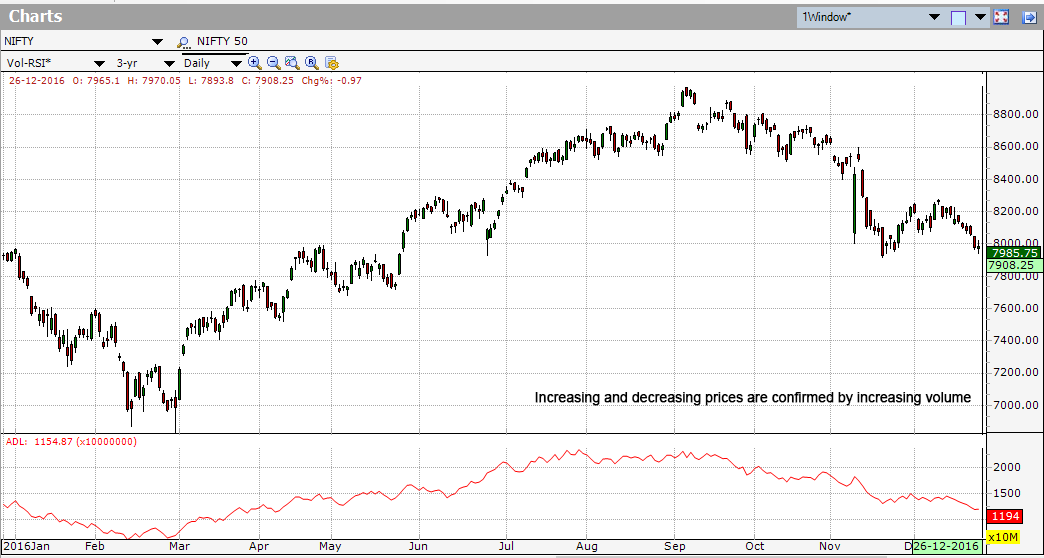
If a security is in a strong downtrend or uptrend, the accumulation/distribution most likely follows the direction of the price movements, and therefore, confirms the downtrend or uptrend.
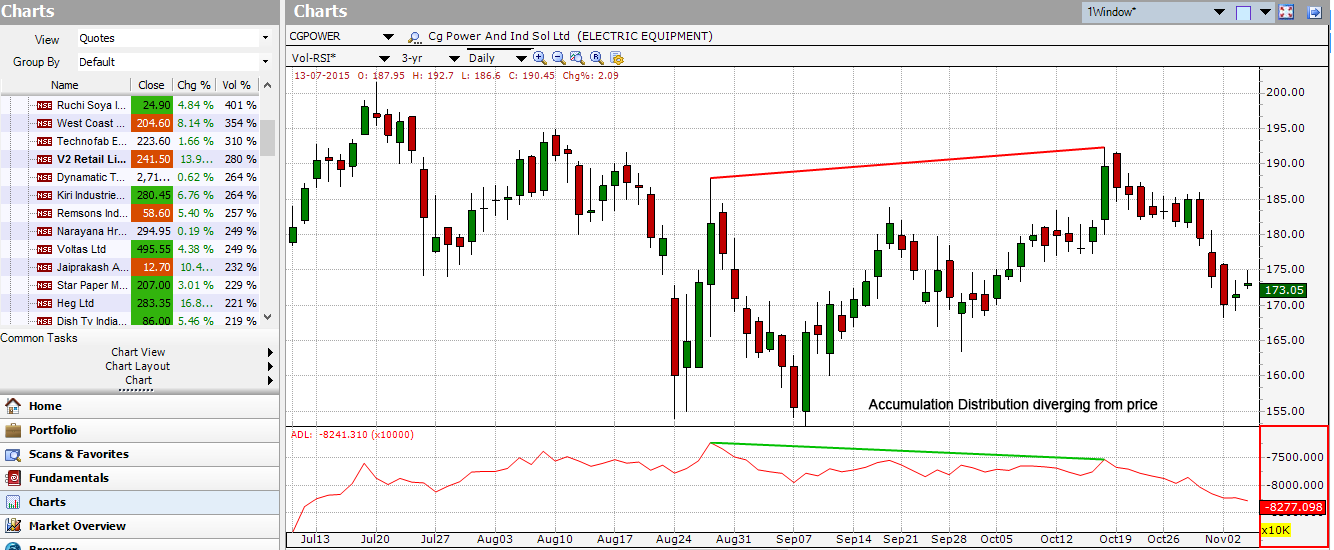
Divergences between the Accumulation/Distribution indicator and the price of the security show the upcoming change of prices. For example, if the indicator is going down and the security’s price is moving up, prices will most likely invert.
The Accumulation/Distribution indicator monitors the relationship between opening and closing prices, along with volume. This is how the formula looks like:
[((Close – Low) – (High – Close)) / (High – Low)] * Period’s Volume = A/D
Where:
Close = the closing price
High = the high of the price range
Low = the low of the price range
The Accumulation/Distribution Indicator does not need precise parameter; rather, the prices are accumulated per candle. For example, if the period is daily, then the indicator accumulates volumes on a daily basis, and so on.
How this indicator works
When both price and Accumulation Distribution are making higher peaks, the upward trend is confirmed.
When both price and Accumulation Distribution are making lower peaks, the downward trend is likely to continue.
During a trading range, rising Accumulation Distribution indicates accumulation may be taking place and hence chances of an upward breakout.
During a trading range, falling Accumulation Distribution indicates distribution may be taking place and hence chances of downward breakout.
When price continues to make higher peaks and Accumulation Distribution fails to make higher peaks, the upward trend is likely to stall or fail. This is called a negative divergence.
When price continues to make lower troughs and Accumulation Distribution fails to make lower peaks, the downward trend is likely to stall or fail. This is called a positive divergence.
The indicator is mostly used to confirm price trends, or even identify potential trend changes in price determined by divergence with the Accumulation/Distribution line.
On Balance Volume (OBV) and the Accumulation Distribution Line (ADL) occasionally differ simply because their formulas are quite different. Both are cumulative volume-based indicators that calculate the flow of volume. OBV is based on the change from one period to the next, but the Accumulation Distribution Line is based on the level of the close determined by the high-low range within a given period. OBV ignores price action within a given period. The Accumulation Distribution Line ignores price action outside a given period.
Just like all indicators, it is very important to use the Accumulation Distribution Line along with other aspects of technical analysis, like momentum oscillators and chart patterns. It is certainly not an independent indicator.