The commodity channel index (CCI) is an oscillator originally introduced by Donald Lambert in 1980. Since its introduction, the indicator has grown in reputation which is currently a very common tool for traders in identifying cyclical trends not just in commodities, but also equities and currencies.
CCI calculates the statistical variance from the average. It is an unbounded oscillator that commonly varies between +100 and -100. Traders use the CCI in many different ways. If CCI goes above 100, it is overbought and it is time to think of selling. Sell signal is generated when it goes below 100.

If CCI goes below -100, it is oversold and time to think of buying. Buy signal is generated when it goes above -100.

Traders use the commodity channel index to help identify price reversals, price extremes and trend strength. Just like the majority of indicators, the CCI should be used in conjunction along with other aspects of technical analysis. It works perfectly whenever the time period is one-third of the asset’s cycle. The drawback in the indicator is that cycles are often difficult to determine, e.g. in the forex market.
Traders have also found the CCI valuable for identifying reversals. The CCI is a versatile indicator proficient at producing a wide array of buy and sell signals.
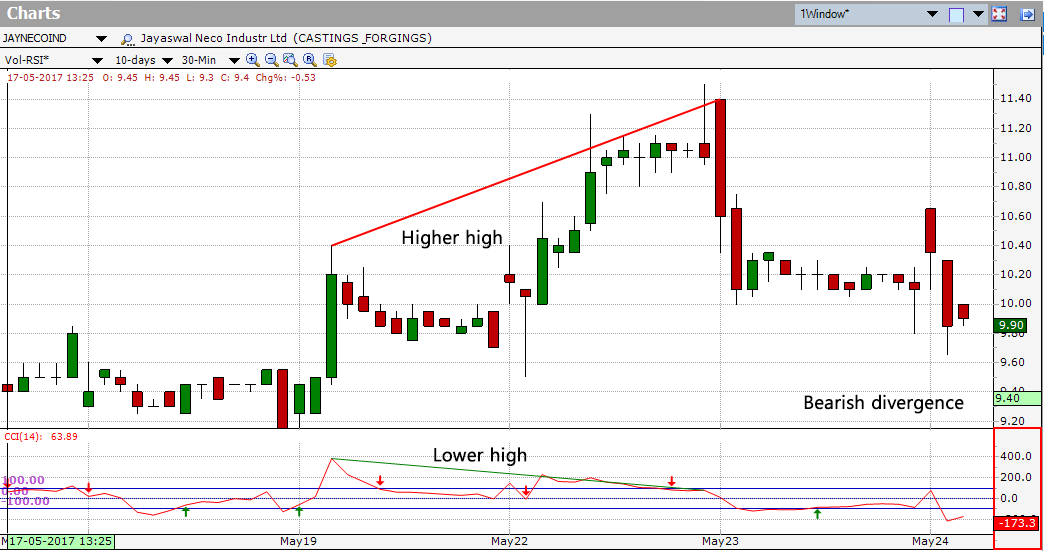
When it comes to most oscillators, divergences can also be applied to improve the strength of signals. A bullish divergence is seen where price makes a lower low but CCI forms a higher low. A bearish divergence is seen when price forms a higher high but CCI makes a lower high. A bearish divergence can also be confirmed with a break below zero in CCI or a support break on the price chart. Conversely, a bullish divergence can also be confirmed with a break above zero in CCI or a resistance break on the price chart.
I liked the information.
I am Bhanu Prakash Yadav Rudra author of the worldwide appreciated book “For beginners Way to Profitable trading”
Sponsored by sharekhan LTD.