Fibonacci retracement is a method of technical analysis for determining support and resistance levels. Fibonacci retracement is based on the possibility that markets will retrace a predictable portion of a move, after which they will continue to move in the original direction. The Fibonacci retracements example can be valuable for swing traders to distinguish reversals on a stock chart. They are named after their use of the Fibonacci sequence.
Fibonacci retracements is created by horizontal lines dividing vertical distance between two endpoints of a trendline by Fibonacci ratios of 23.6%, 38.2%, 50%, 61.8% and 100%. The most popular Fibonacci Retracements are 61.8% and 38.2%.
0.0% is considered to be the start of the retracement, while 100.0% is a complete reversal to the original part of the move. Once these levels are identified, horizontal lines are drawn and used to identify possible support and resistance levels.
How to draw a Fibonacci Retracement
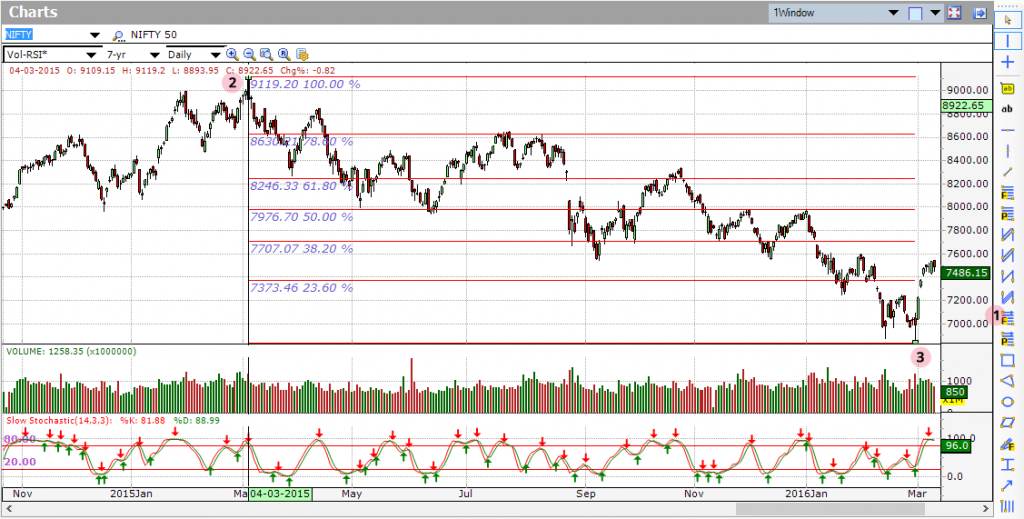
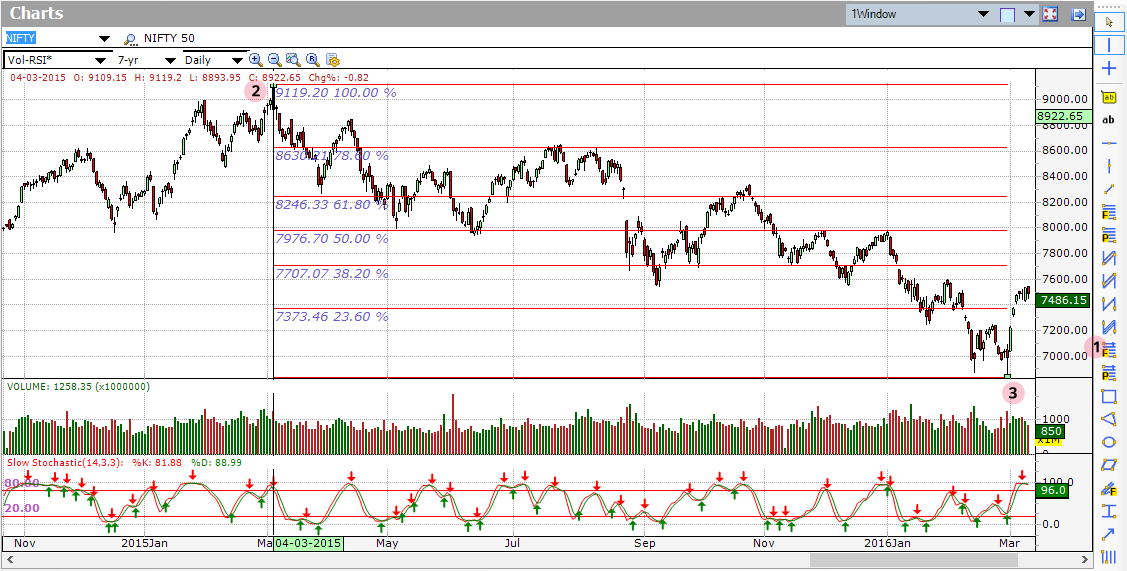
First select on the Fibonacci Retracement tool from the drawing section at the right side of the window (1). Next, click-and-hold your mouse at the start of a significant price move (2), then drag your mouse to the end of that price move (3) while keeping on holding down the mouse button. The Fibonacci retracement lines ought to show up as you drag your mouse.
When you draw a Fibonacci on a chart, you will see that Fibonacci lines up with support and resistance areas that you would see at any rate without drawing the lines! So you truly don’t have to draw the lines. Rather, you can simply use Investar Auto SR feature to take a look at a chart and see where the levels are.
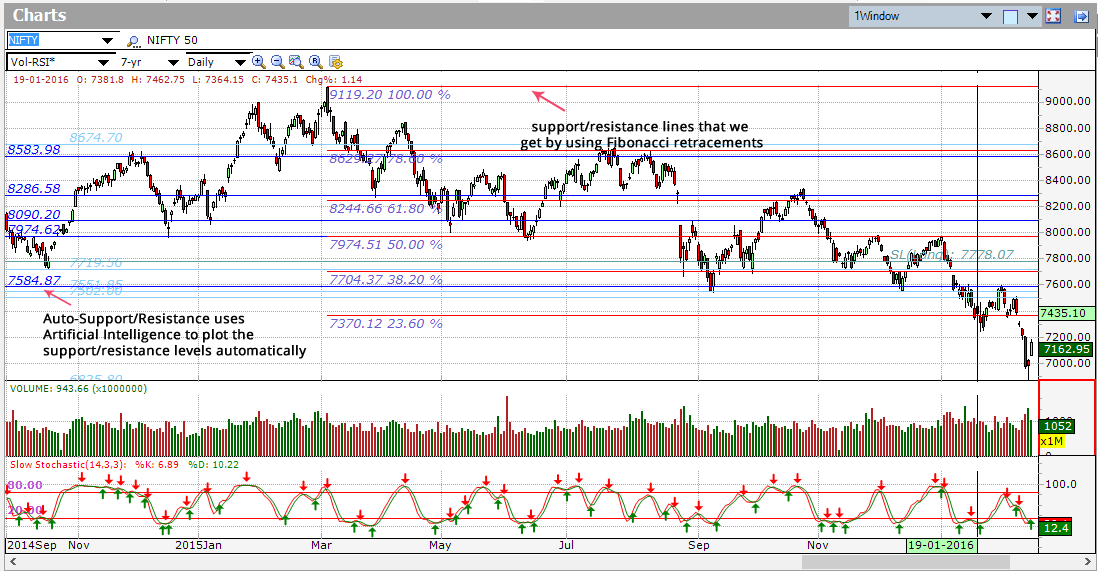
As you can see in the chart above (where the retracement is drawn from the peak in Mar 2015 to the low in Feb 2016), the support/resistance lines that we get by using Fibonacci retracements may not be sufficient. The real support/resistance are derived by hand-drawing the support/resistance lines through actual peaks and lows, or alternatively, it can be automatically drawn using the Auto-SR feature in Investar. Auto-SR or Auto-Support/Resistance uses Artificial Intelligence to plot the support/resistance levels automatically and rate all the lines just as an expert Technical Analyst would. You can read more about Auto-SR here or see a video here. E.g. the Fibonacci retracements are able to capture the 7974 and 7704 levels well, but they missed out on the key 8090 and 8286 levels which were obtained by using Auto-SR. This is because Fibonacci retracements create artificial support/resistance levels because of a lot of traders using those levels, but the real support/resistance levels are created due to supply/demand imbalances in the stock price chart, which are best detected by lines going through highs and lows.
good
I must accept that you provide some fantastic information regarding Fibonacci. Keep spreading this kind of information to help many individuals.