Financial ratios allow an analyst to immediately analyze a business and its operations and understand the financial situation of a company, it is important to know exactly what to do with this data and how to interpret it.
Financial ratios
Financial ratios are the most common and widespread tool used to analyze a business’ financial position. Ratios are easy to understand and simple to figure out. They can also be used to compare different companies in different industries. Here are some important financial ratios to help you better understand the company you are planning to invest in.
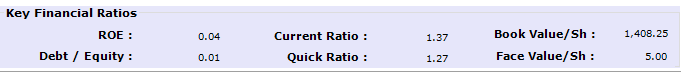
In Investar we support the above-mentioned Key Financial Ratios.So without further ado, let’s get to the list of financial ratios every investor needs to know.
ROE: Return on equity (ROE) is a measure of the profitability of a business in terms of the book value of shareholder equity, also known as net assets or assets minus liabilities. ROE is a measure of how well a company makes use of investments to generate earnings growth. Return on Equity is calculated by the simple formula
Return on Equity = Net Profit/Net Worth
where “Net Profit” means company profit, and “Net Worth ” refers to the amount of money maintained and invested in the business. ROE is especially used for comparing the performance of companies in the same industry. As with return on capital, ROE is a measure of management’s ability to generate income from the equity available to it. ROEs of 15-20% are generally considered good. Companies in different sectors of the market will have different ROEs, which means you can’t compare the ROE of a tech stock with that of a bank
A company with a high ROE is much more prone to put money back into your pocket in the long run, which makes it a more solid investment.
Debt / Equity: The debt-to-equity ratio (D/E) is a financial ratio showing the relative proportion of shareholders’ equity and debt utilized to finance a company’s assets. The debt to equity ratio shows the percentage of company financing that comes from creditors and investors. This ratio is also known as financial leverage.
Debt-to-equity ratio is the key financial ratio which is used as a standard for estimating a company’s financial position. It is also a measure of a company’s capability to repay its obligations. When evaluating the well-being of a company, it is critical to pay attention to the debt/equity ratio.
The formula for calculating D/E ratios can be represented in the following way:
Debt – Equity Ratio = Total Debt/Net Worth
Both values you can get from balance sheet data.
The result may often be expressed as a number or as a percentage.
Investing in a company with a higher debt to equity ratio might be riskier, especially in times of increasing interest rates, due to the additional interest that has to be paid out for the debt. In general, a high debt-to-equity ratio indicates that a company may not be able to produce enough cash to satisfy its debt obligations. However, a low debt-to-equity ratio might also suggest that a company is not making the most of the increased profits that financial leverage may bring.
Current Ratio: The current ratio is a liquidity ratio that measures whether or not a company has enough resources to satisfy its short-term obligations. Potential creditors make use of this ratio in determining whether or not to make short-term loans.
The formula for calculating a company’s current ratio, then, is:
Current Ratio = Current Assets / Current Liabilities
The current ratio is called “current” simply because, unlike some other liquidity ratios, it incorporates all current assets and liabilities.
The current ratio is also known as the working capital ratio.
The current ratio is an indication of a firm’s liquidity. Acceptable current ratios vary from industry to industry. In many cases, a creditor would consider a high current ratio to be better than a low current ratio because a high current ratio indicates that the company is much more likely to pay the creditor back. If current liabilities balance out current assets, then the company might have problems meeting its short-term obligations.
One limitation of using the current ratio emerges when using the ratio to compare different companies with one another. Because business operations can differ substantially between industries, evaluating the current ratios of companies in different industries with one another will not necessarily lead to any productive insight.
Quick Ratio: The quick ratio is a measure of a company’s ability to meet its short-term obligations using its most liquid assets, Also called the acid test.The concept is to show how well current liabilities are covered by cash and by items with a ready cash value. It is the ratio between quick or liquid assets and current liabilities, and is calculated as follows:
Quick ratio = (Cash equivalents + marketable securities + accounts receivables) / Current liabilities
All of those variables values you can get from balance sheet data
Computing liquid assets inventories are deducted as less liquid from all current assets (inventories tend to be difficult to convert to cash).
The acid test ratio measures the liquidity of a company by displaying its capability to pay off its current liabilities with quick assets. If a firm has enough quick assets to handle its total current liabilities, the company will be able to pay off its obligations without having to sell off any long-term or capital assets.
Higher quick ratios are more favorable for companies because it shows there are more quick assets than current liabilities. A company with a quick ratio of 1 signifies that quick assets equal current assets. This also shows that the company could possibly pay off its current liabilities without selling any long-term assets. An acid ratio of 2 implies that the company has twice as many quick assets than current liabilities.
Book Value/Sh: Book value per share indicates the book value of each share of stock. The term “book value” is a company’s assets minus its liabilities and is occasionally referred to as stockholder’s equity, owner’s equity, shareholder’s equity, or simply equity.
Book value per share gives us a rough idea about the true value of a business. Though book value is not a very reliable indicator of true value but its still useful. However, book value is not market value. Book value per share is just one of the approaches for comparison in valuing of a company.
Book value may be taken into consideration in varying degree in putting a market value on a business and its ownership shares. One shall examine balance sheet of the company to know its book value. In order to calculate net worth (book value) of a company, we need to find a sum of equity capital & accumulated reserves. Companies equity capital and accumulated reserves figures are presented in companies balance sheets. Book value is alternatively also called as shareholders equity.
The book value per share can be utilized by some investors to determine the equity in a company relative to the market value of the company, which is the price of its stock. Book value per share is also used in the return on equity formula, or ROE formula, when computing on a per share basis.
Face Value/Sh: Face value, also referred to as par value or nominal value, is the value shown on the face of a security certificate, including currency. Face value, or par value, does not have any relation to the market value of a stock.
The par value of a share is the value mentioned in the corporate charter below which shares of that class cannot be sold upon initial offering; the issuing company promises not to issue further shares below par value, so investors can be confident that no one else will receive a more favorable issue price. Thus, par value is the nominal value of a security which is determined by the issuing company to be its minimum price.
It is important to note that in terms of stocks, face value (or par value) generally has no relation to market price. Bond prices, however, are heavily influenced by their face value. Bonds are usually quoted as a percentage of face value. However, their prices can rise above (premium) or drop below (discount) their face value based on changes in interest rates and the financial health of the underlying issuer.