What are Heikin-Ashi Candlestick Charts?
Heikin-Ashi means “average bar” in Japanese. Heikin-Ashi Candlesticks use the open-close data from the previous period and the open-high-low-close data from the current period to create an average candlestick. As a result of the averaging, Heikin-Ashi candlesticks won’t show the exact open, high, low and close for that period like a standard candlestick would.
Heikin Ashi helps a trader to eliminate the undesirable noise from the chart. It provides a very smooth trend as well as the strength of the trend.
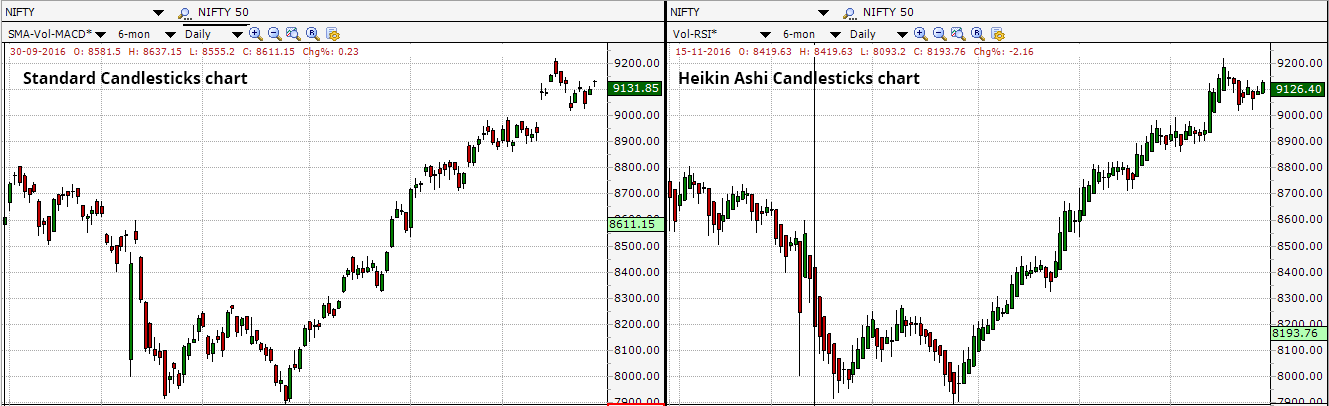
Heikin-Ashi Candlesticks are similar, but different than standard candlesticks. In the candlestick chart, each and every candlestick is independent and does not have any relationship with the prior or next candlesticks.
However Heikin-Ashi candlesticks are very different and each and every candlestick is computed and plotted using some information from the prior candle:
- Open price: the open price in a Heikin-Ashi candlestick is the average of the open and close of the prior Heiken-Ashi candlestick.
- Close price: the close price in a Heikin-Ashi candlestick is simply an average of the open, high, low and close for the current period.
- High price: the current period’s high price in a Heikin-Ashi candlestick is selected from one of the current candlestick high, current Heiken-Ashi open and current Heiken-Ashi close, whichever is having the highest value.
- Low price: the current period’s low price in a Heikin-Ashi candlestick is selected from one of the current candlestick low, current Heiken-Ashi open and current Heiken-Ashi close, whichever is having the lowest value.
Heikin-Ashi chart is slower than a candlestick chart and its signals are delayed mainly because of the averaging of the prices.
Why Heikin Ashi candlesticks are better?
The benefit of the Heikin Ashi candestick is its visual simplicity:
- Green/white candles with no lower shadows indicate a Strong Uptrend.
- Black/Red candle with no upper shadow indicate a Strong Downtrend.
- One candle with a small body surrounded by upper and lower shadows indicates change of trend.
- Small Heikin-Ashi candlesticks or those with long upper and lower shadows show indecision.
Heikin-Ashi is great for the swing traders who love to follow the trends. It works very well when the market trends. However, it becomes hard to trade the ranging and sideways markets with Heikin-Ashi, compared to regular candlesticks.
Setting the Heikin-Ashi Chart Type in Investar
To set the Chart Type:
Step 1: View Stock Chart / Future/Option Chart whose Chart Type is to be changed.
Step 2: Select a Chart Type from the Chart Standard Toolbar on top as follows:
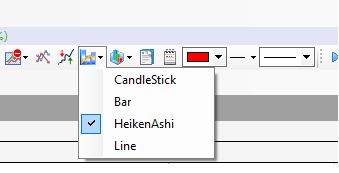
Or Right click on the chart and select Chart Type.
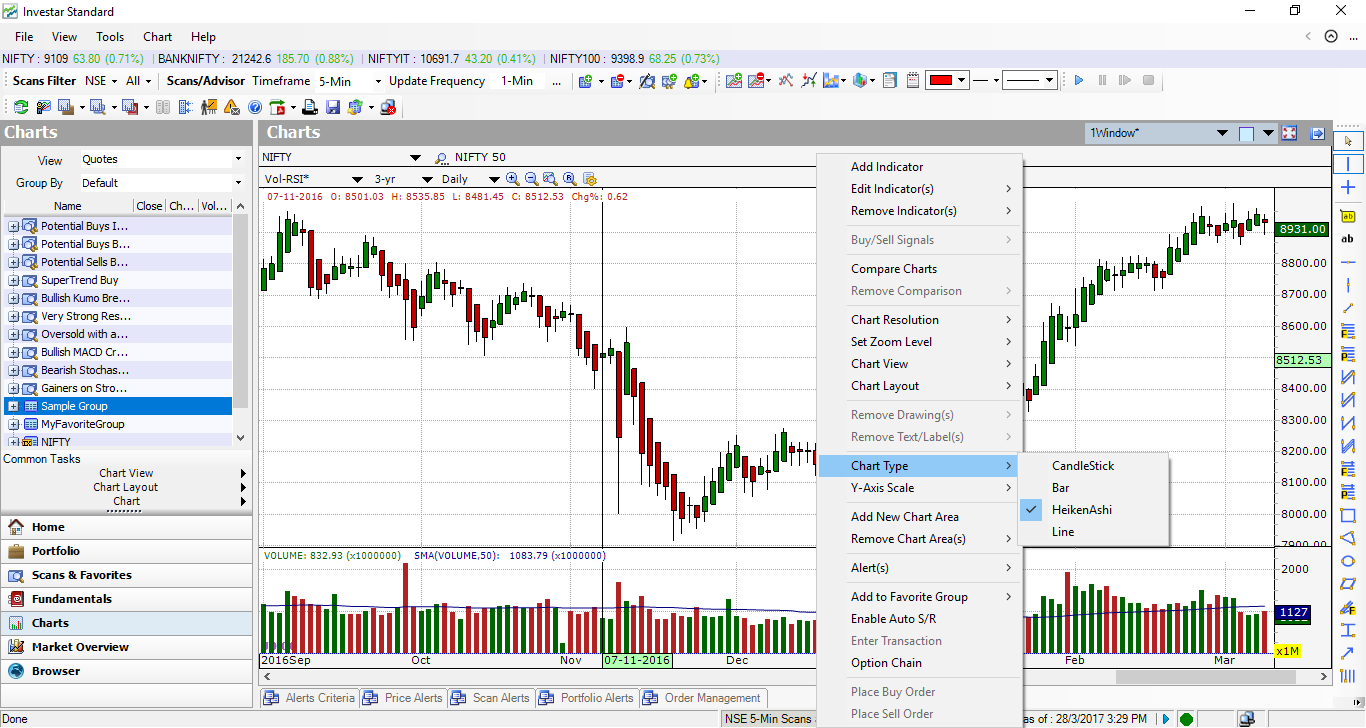
Step 3: Chart of the selected Chart Type will be displayed.
With Investar, it is possible to see charts in two different chart type very easily. All you do select Chart Layout from top right corner. See the picture below

With Chart Layout feature you can simply see any scrip using any chart type to compare how they look in different chart type. All you do is create two different Chart Views and save them in a Chart Layout.
To see this in action, here is a screenshot of Investar with a 2-chart layout showing NIFTY:
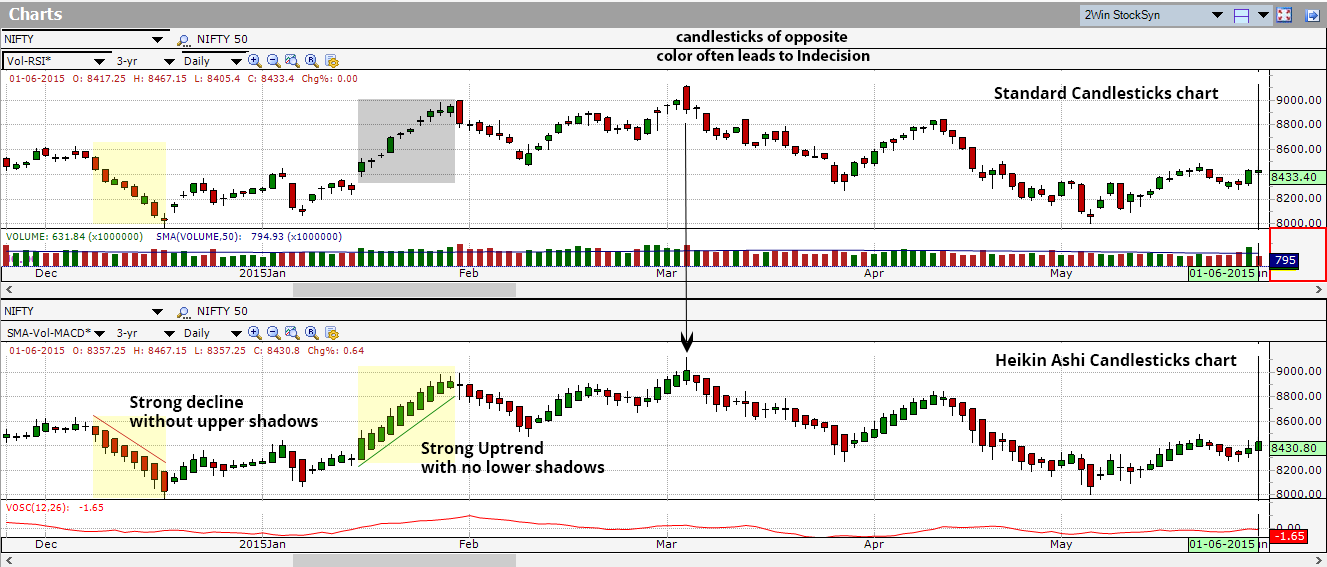
Heiken Ashi candlestick filters out some noise in order to better capture the trend. The green arrow indicates a strong uptrend by a series of Heikin-Ashi Candlesticks without lower shadows. The red arrows show a strong decline marked by a series of Heikin-Ashi Candlesticks without upper shadows. The arrows show indecisive Heikin-Ashi Candlesticks.
The Heikin-Ashi technique is very effective for making candlestick charts a lot more readable–trends can be located more readily, as well as buying possibilities could be observed straight away.