One of the most powerful features of Investar is Auto Support/Resistance. Auto-Support/Resistance (Auto S/R) uses Artificial Intelligence to automatically plot the support/resistance levels on visiting a chart and rate them based on the strength of different levels analysis just as an expert Technical Analyst.
Refer our earlier blog post About Auto-Support/Resistance to get more detailed insight about what exactly Auto Support/Resistance does.
But the biggest benefit of using Auto-Support/Resistance (Auto S/R) is the scans that you get when using this feature.
In Investar, we have several user-friendly Auto S/R based scans to help you identify breakouts and breakdowns, and they are shown in the picture below (Hint: Click on the Manage Scans toolbar button to get to this window). All you have to do is to select any of the following scans from Predefined scans list:
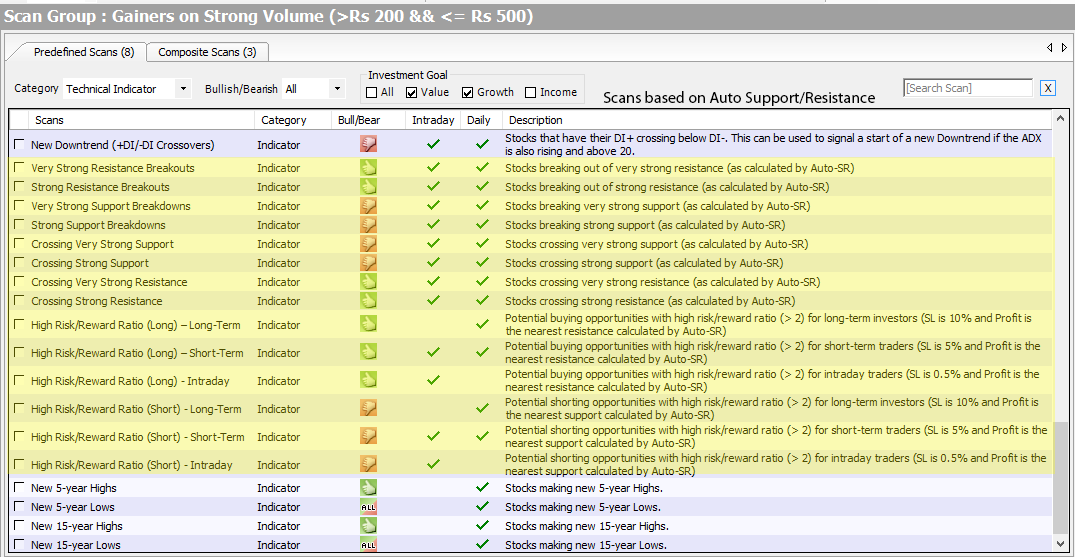
Resistance based scans such as all Breakout scans help in identifying those stocks which are breaking out of resistance and they are typically the stocks which are breaking out after the sideways trends.
So, we would suggest using this scans to identifying breakouts (and potentially multi-baggers). In the same way, Support-based scans such as all Breakdown scans help in identifying stocks which break down after sideways trading, and they can be used to identify candidates for shorting.
Auto SR scans help to identify opportunities for either Breakout trading or sideways trading.
Simply follow the steps to add scans in the charts:
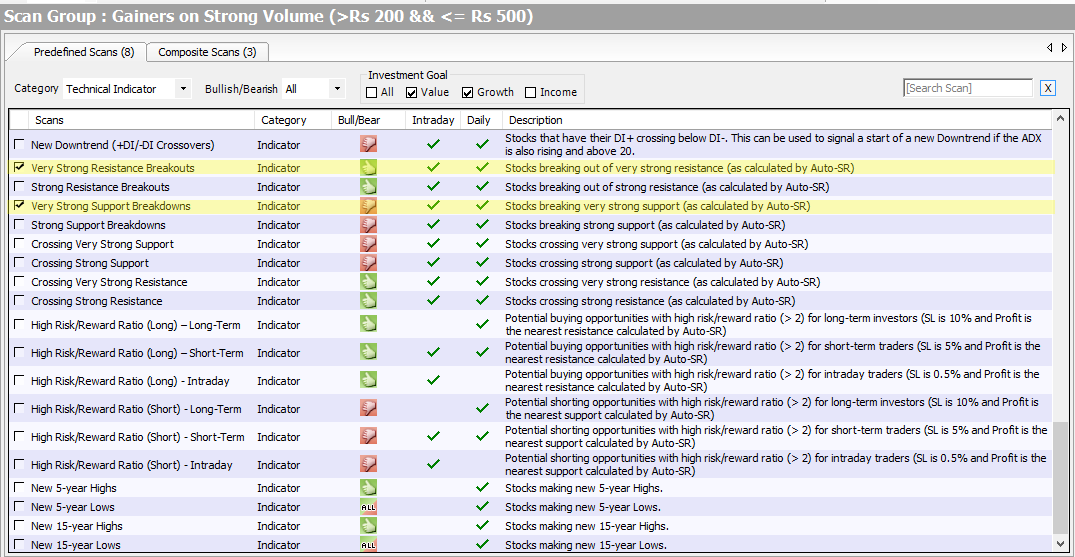
(1) Click on Managed Scan button and the predefined list of scans will appear, (2) scroll down to select scans you want to use based on Auto S/R or simply type in the search box and select the scans and (3) click Apply/Ok.
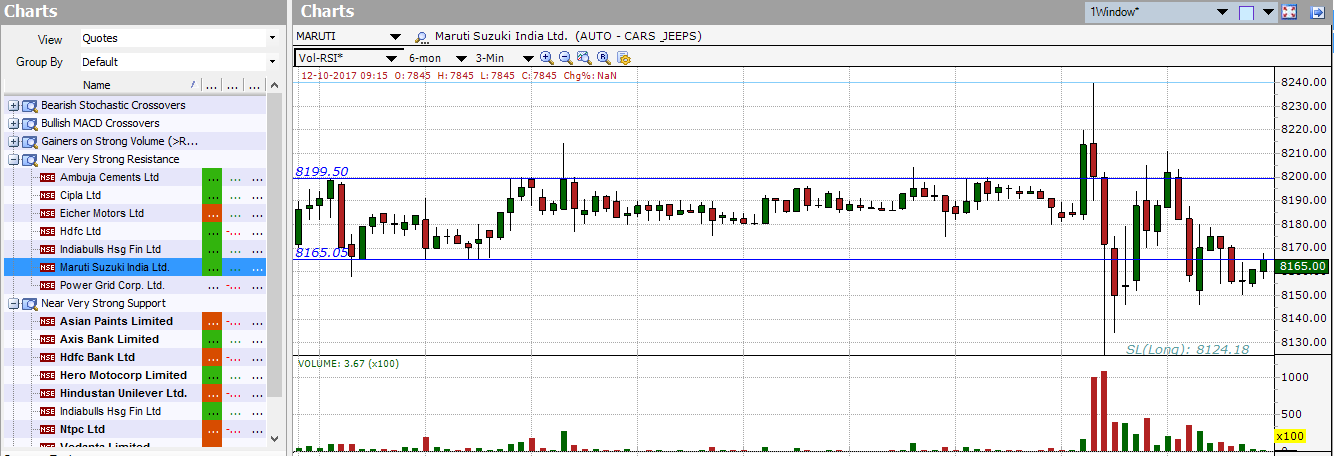
After clicking on Apply button you can see the selected pre-defined scan appear in the navigation pane within split seconds.
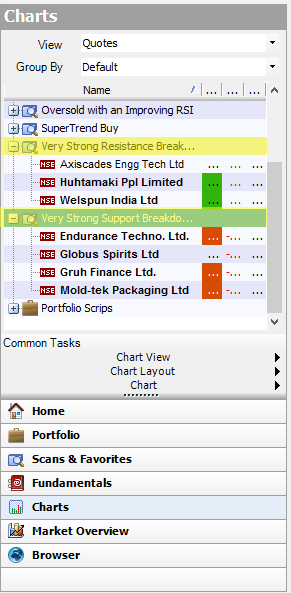
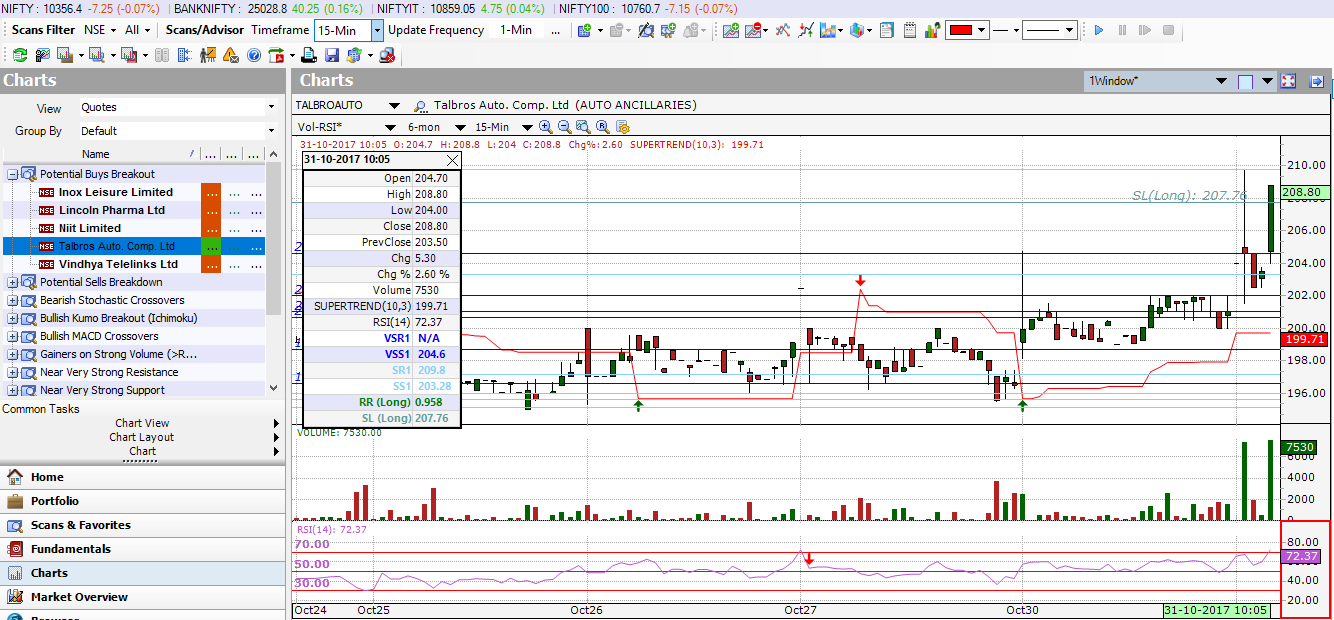
Now simply click on any stock to see it’s chart at the right side as shown in figure:
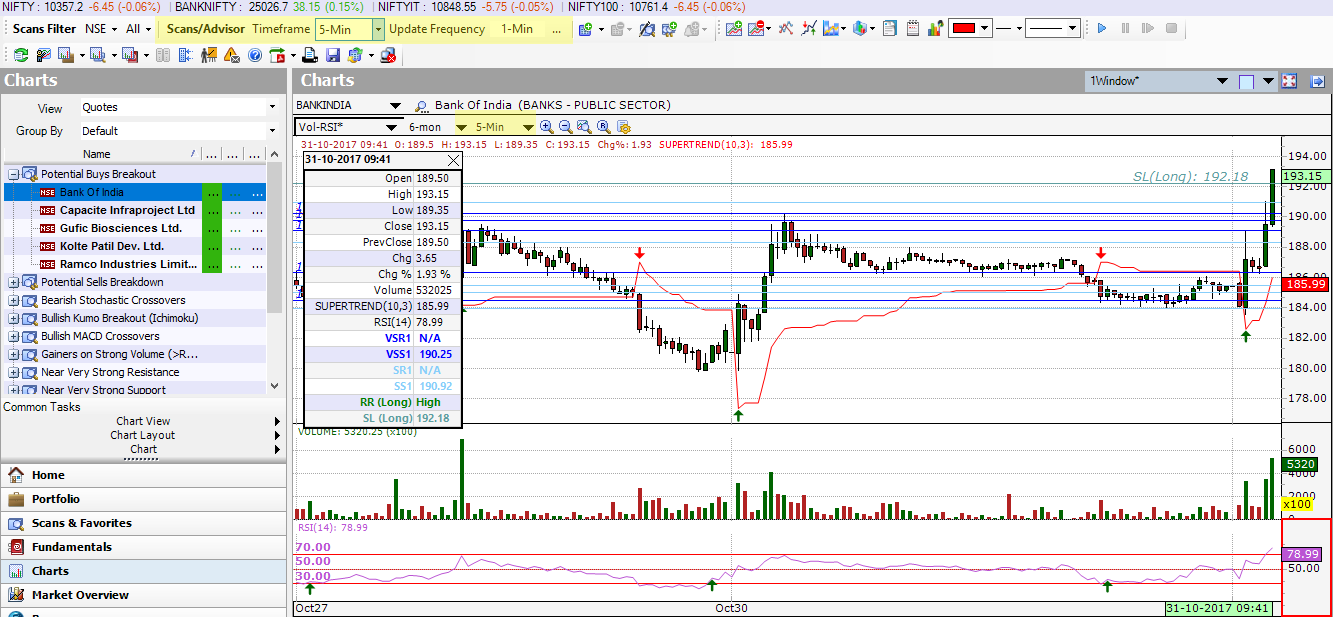
Note: The scans will update based on the time frame you choose in Scans/Advisor Timeframe and the Update Frequency. E.g. in the above image, you can see the scan identifying stocks in a 5-min timeframe. The chart shows some of the key Auto-SR levels – dark blue are the very strong levels (top 20%ile), and light blue are the strong levels (next 20%ile), and you can see that the dark blue “very strong resistance” line is being broken when the stock appeared in the “Potential Buys Breakout” scan.
If you are a sideways trader, then the Near Strong Resistance/Support scans would be useful. To use that, simply go to Managed Scan button and type in the search box and select the scans and click Apply/Ok.
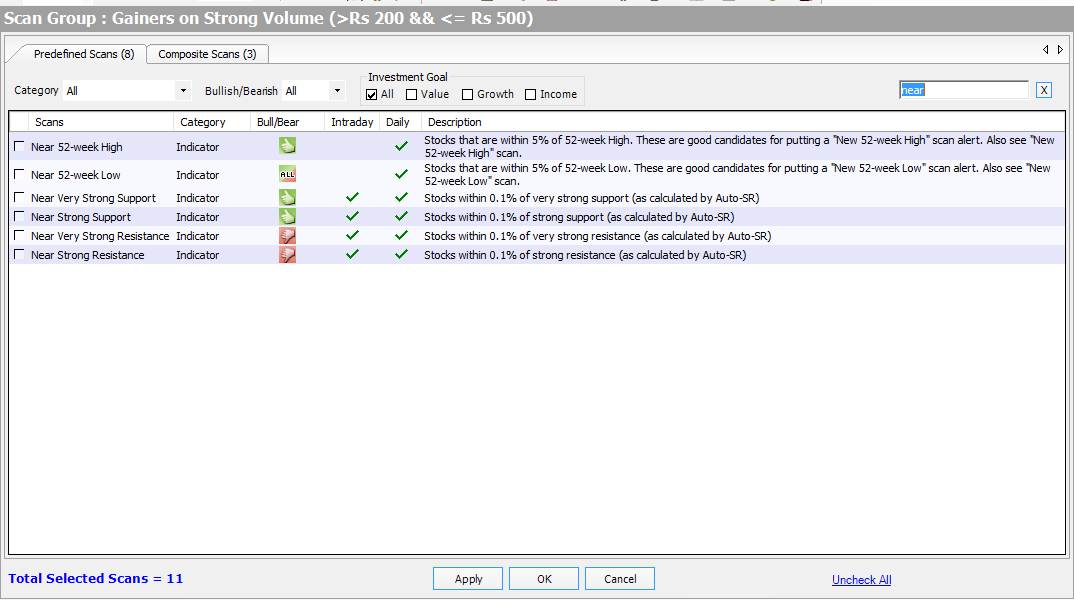
You will see all the “Near” related scans over here. (In above screenshot), Simply click on “Near Very Strong Support” and “Near Very Strong Resistance” Scans and click on the Ok Button.
And now you can see that all the scans related to Near Very Strong Support and Resistance are listed in Navigation Pane.
Investar by default gives 3 pre-defined Composite Scans (you can always edit composite scans) which are based on Auto Support/Resistance:
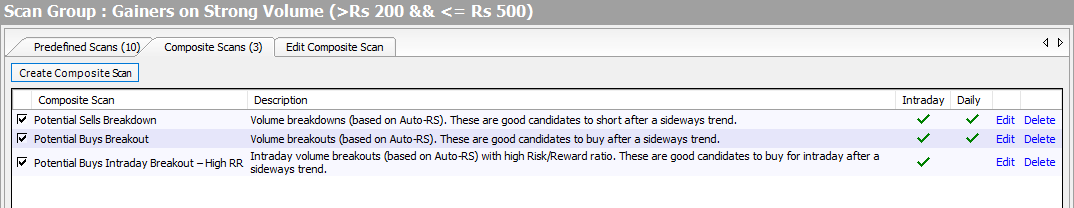
To see what these above-mentioned scans are, you can simply edit any one of the scan. Let’s see what “Potential Buys Intraday Breakout – High RR” scans is:
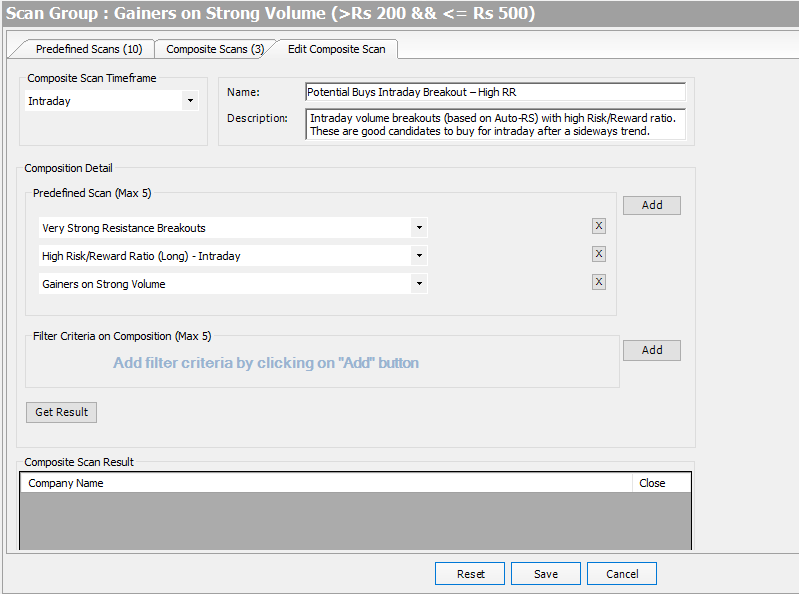
Potential Buys Intraday Breakout – High RR: It combines 3 scans i.e: Very Strong Resistance breakout, High Risk/Reward Ratio (Long) – Intraday and Gainers on Strong Volume. Watch our video, Using Investar Auto-SR scans for identifying intraday volume breakouts ,to see a real example of a successful intraday breakout captured using this scan which gave a 2% gain within a few minutes.
If you are a Day trader, you can simply monitor the scans “Potential Buys Breakout” during the day in different time-frames, whatever time-frame you choose may be it 3mins, 5mins, or 15-mins and you will definitely see some interesting volume breakouts in intraday.
As you can see that in above screenshot, “Potential Buys Breakout” had captured a stock with both breaking out on very strong resistance and having gainers on strong volume.
For more details, check out our video on “Auto Support/Resistance Tips and Tricks” for an in-depth look into this topic :
Interseting. Thanks for the post