Stochastics Oscillator is a momentum oscillator that helps to measure the current price in relation to its price range over a period of time. It functions as an overbought/oversold oscillator. It consists of 2 lines (%K & %D).
The Common Parameters: 14,3,3. It is a momentum indicator that was developed by George C. Lane in the late 1950s. Stochastics comes in two versions, Fast Stochastics and Slow Stochastics. This post will talk about the Slow Stochastics, which is the more popular oscillator used.
| %K = (Current Close – Lowest Low(n))/(Highest High(n) – Lowest Low(n)) * 100 |
| %D = 3-day SMA of %K |
Note: This formula is only for sake of interest.
Explanation:
To calculate the slow stochastics, replace “n” with the range you are monitoring.
Current Close =the most recent closing price.
Lowest Low = the lowest price during the 14-day period.
Highest High= the highest price during the 14-day period.
%D is a 3-day simple moving average of %K.
There are two strategies used with Stochastics:
Strategy 1:
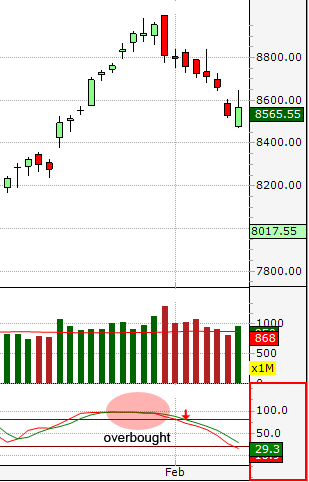
If Stochastics (%K) goes above 80, it is overbought and it is time to think of selling. Sell signal is generated once it goes below 80.
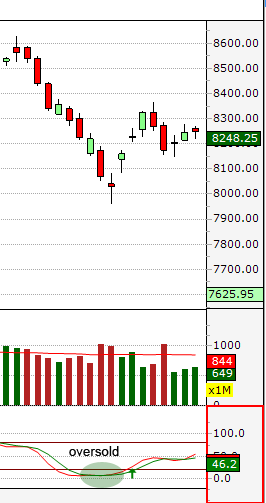
If %K goes below 20, it is oversold and time to think of buying. Buy signal is generated once it goes above 20.
Strategy 2:
This 2nd strategy is based on crossovers of the faster moving %K line and the slower moving %D line. In this case the Buy and Sell signals are generated as follows:
Buy signal – Buy when the %K line rises above the %D line.
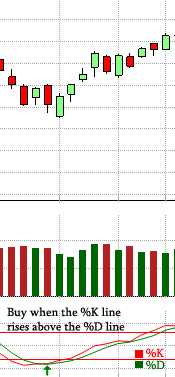
%K line rises above the %D line
Sell signal – Sell when the %K line falls below the %D line.
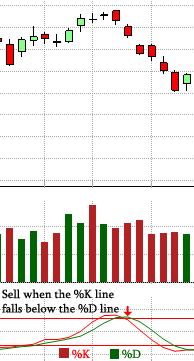
%K line falls below the %D line
Divergence-convergence is an indication that the momentum in the market is waning and a reversal may be in the making. A bearish divergence frames when price has a higher high, yet the Stochastic Oscillator frames a lower high.
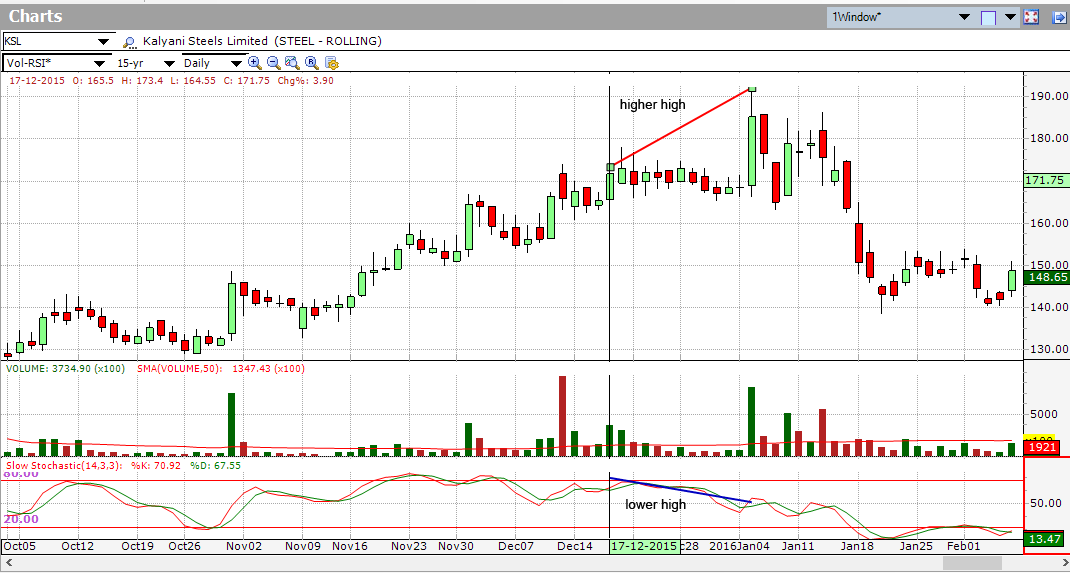
In above example, KSL shows bearish divergence in December 2015.
A bullish divergence happens when price has a lower low, yet the Stochastic Oscillator frames a higher low.
An event known as “stochastic pop” occurs when prices break out and keep going. This is interpreted as a signal to increase the current position, or liquidate if the direction is against the current position.
More details about the divergence are given in a detailed post titled “Trading Divergences”.