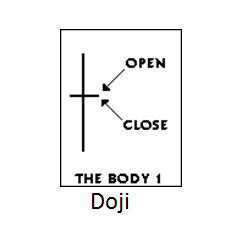
The Doji candlestick pattern has a single candle. It is characterized by being small in length—meaning a small trading range—with an opening and closing price that are virtually equal.
Anatomy of a Candlestick
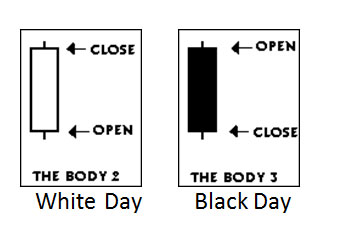
Each candlestick is based on an open, high, low and close. The filled or hollow bar created by the candlestick pattern is called the body. The lines above and below, known as shadows, tails, or wicks represent the high and low price ranges within a specified time period. However, not all candlesticks have shadows. If the closing price is above the opening price, then normally a green or a hollow candlestick (white with black outline) is shown. If the opening price is above the closing price, then a filled (normally red or black) candlestick is drawn.
How does a Doji Pattern Form?
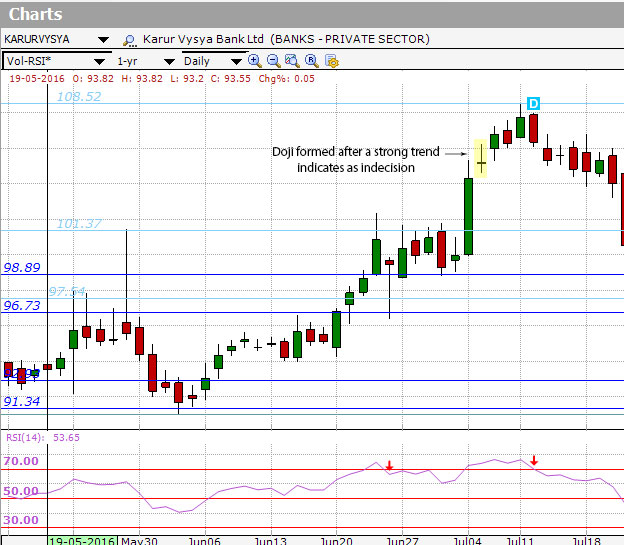
The Doji represents indecision in the market. The Doji is not as significant if the market is not clearly trending, as non-trending markets are inherently indicative of indecision. If the Doji forms in an uptrend or downtrend, this is normally seen as significant, as it is a signal that the buyers are losing conviction when formed in an uptrend and a signal that sellers are losing conviction if seen in a downtrend. Hence Doji Patterns are ideally used as reversal patterns after an uptrend or downtrend.
When the body is absent in a candlestick (i.e. the open is virtually same as close), the candlestick formation is called Doji, and it is one of the most important candlestick formations in Technical Analysis.
The Doji is a key trend reversal indicator. This is particularly true when there is a high trading volume following an extended move in either direction. When a market has been in an uptrend and trades to a higher high than the previous three trading days, fails to hold that high, and closes in the lower 10% of that day’s trading range, there is a high probability of a downtrend in the ensuing days.
Likewise, when the market has been in a downtrend and trades to a new low that’s lower than the three previous trading days, fails to hold that low, and closes in the upper 10% of that day’s trading range, there is a high probability of an uptrend in the ensuing days.
The Doji has different names depending on the location of its real body, or rather, the lengths of the upper and lower shadows.
- Neutral Doji
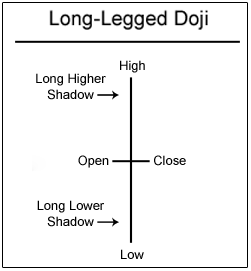
- Long-Legged Doji
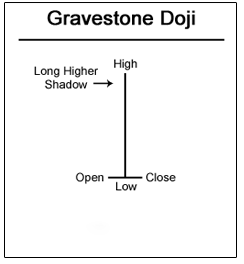
- Gravestone Doji
- Dragonfly Doji
Neutral: Dojis form when the opening and closing prices are virtually equal. This pattern forms when buying and selling activity is at equilibrium. Alone, dojis are neutral patterns.

Long-Legged: This doji reflects a great amount of indecision about the future direction of the underlying asset. The stock open and close at the middle of the day’s high and low. This pattern forms when supply and demand forces are at equilibrium.
Gravestone: The long upper shadow suggests that the direction of the uptrend may be nearing a major turning point. It is formed when the opening and closing price of the underlying asset are equal and occur at the low of the day.
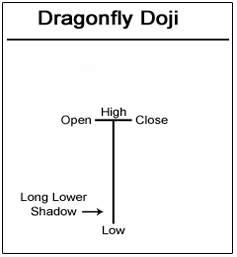
Dragonfly: The long lower shadow suggests that the direction of the prior downtrend may be nearing a major turning point. It is formed when the opening and closing price of the underlying asset are nearly equal and occur at the high of the day.
There are also a few special doji to watch for. Some form patterns with fantastic names like abandoned baby, morning star, evening star, and tri-star.
How to Trade a Doji Candlestick Pattern
To trade Doji patterns, you need a confirmation signal on the next candle. You want to identify the doji high and the doji low as this will determine the support and resistance levels of a potential breakout or breakdown. If it is a Gravestone Doji, it gives you a sell signal when the the doji low is broken on the next candlestick. If it is a Dragonfly Doji, it gives you a buy signal when the the doji high is broken on the next candlestick.
Gravestone Doji is a reversal stock trading pattern which can be bearish as well as bullish based on the position of Gravestone Doji candlestick. So if the market is in an uptrend and if you notice a Gravestone Doji candlestick, it may be the first indication that the trend may start to reverse to a downtrend.
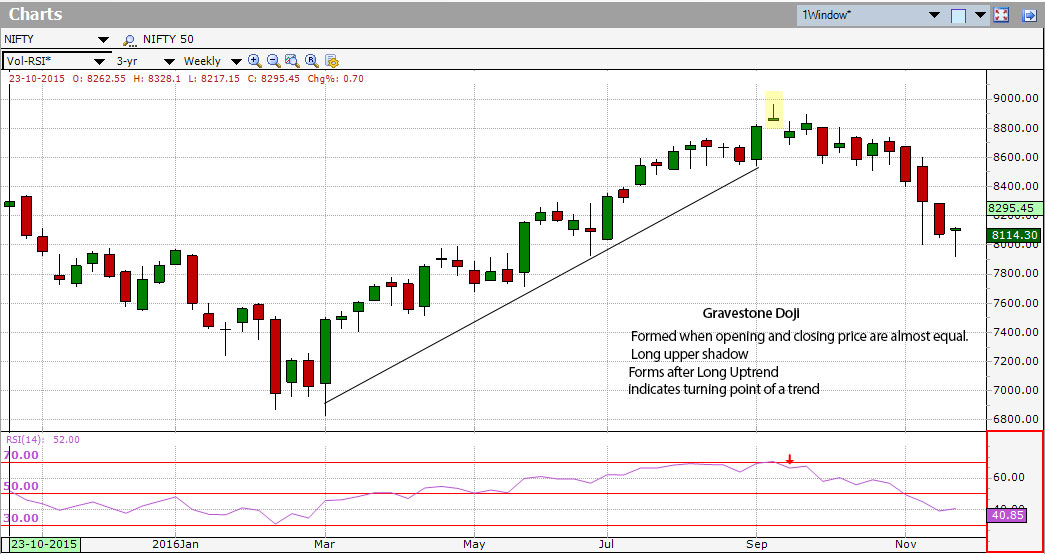
The above image is of a bearish Gravestone Doji pattern. As shown in the chart, we can see that nifty was in uptrend until the Gravestone Doji formed. A short signal comes on the second candle after the Gravestone Doji with a break and close below the gravestone doji line that indicates a change in trend or “Party over for the bulls” for a short time.
Dragonfly Doji can be bullish or bearish. But this pattern works better in bullish reversal.
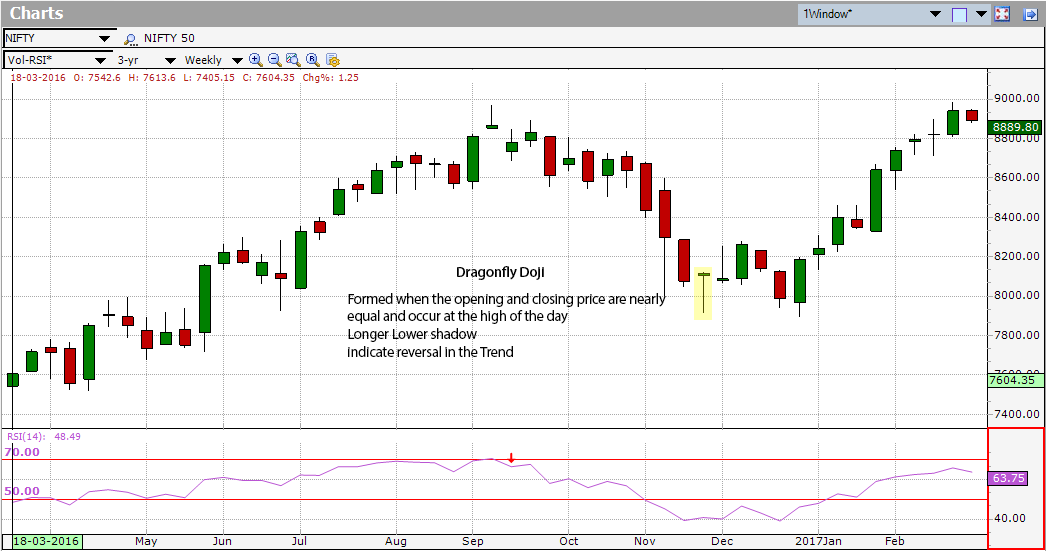
The above image is of a bullish Dragonfly Doji pattern. As shown in the chart, we can see that nifty was in a downtrend until the Dragonfly Doji formed. After a downtrend, the Dragonfly Doji can signal to traders that the downtrend could be over and that short positions could potentially be covered.
Keep in mind that the Dragonfly and Gravestone Doji patterns are indication us of a change in trader sentiment.