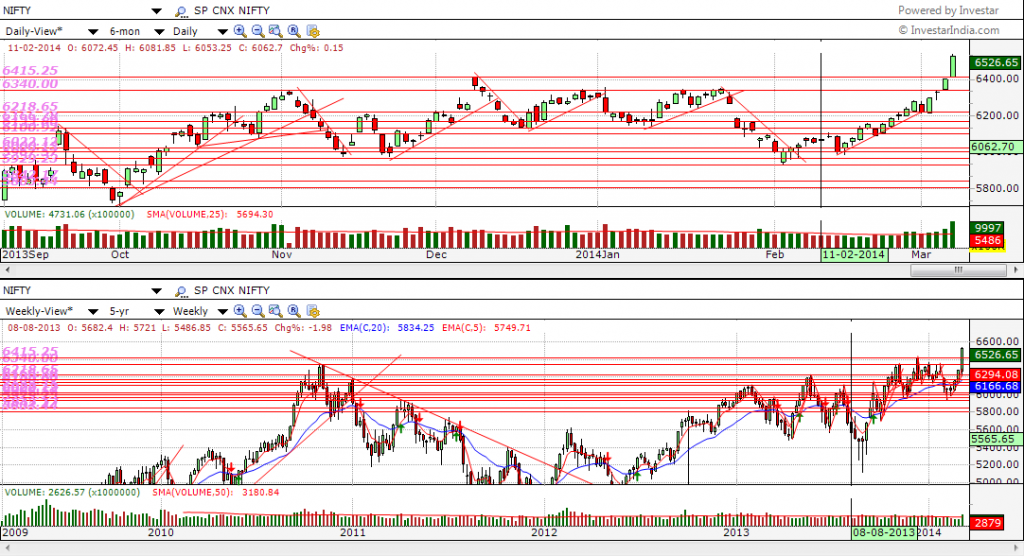
Last week the Nifty broke above the weekly resistance of 6340 emphatically and closed at 6526, a new all-time high. The rise is attributed to the strong chances of a stable government under NDA after the elections. The volume was very strong when the breakout happened on Friday (as shown in the Chart below):
We have two observations to make that indicates a start of a new long-term uptrend (see attached chart):
- 6340 resistance was a very strong resistance (based on the number of touches – there are 5 touches as visible in the chart below, our “Basics of Technical Analysis” webinar attendees will recall how these are found)
- Volume was also unusually strong on the day of the breakout, i.e. Friday. Both the facts above are a very positive sign and an indication that the breakout is strong and the chances of success of the rally are high.
As the Weekly and Daily chart shows, the action on 9th March, indicates a start of both a short-term trend and long-term trend and hence would be a great time to start looking for volume breakouts. The beauty of the volume breakout strategy is that you can use the volume and new-high scans to search for stocks that are breaking out and almost every day you will find new ideas if you were to use a good scanning tool like the one in Investar. You can continue doing that every day after the start of the uptrend, as not all stocks start rallying at the same time. You enter a stock only when it breaks out on strong volume.
Obviously the Screener is an important tool to have when you want to use this strategy. Here are some short-training videos that can help understand how to use the Investar Screener and Scan alerts. We are also planning to conduct some webinars on using the intraday screener in the future.

Good Analysis!! Team 😛 Breakouts can be good to trade. Have to see how it goes.
All the best!!
All the share market prediction is based on fundamental and technical analysis which is helpful for getting best results 🙂 . You did it very well. thanks