This is the 2nd part where we will see all the advanced drawing tools used for Technical Analysis.You can read the first part, focusing on the basic drawing tools used for Technical analysis here.
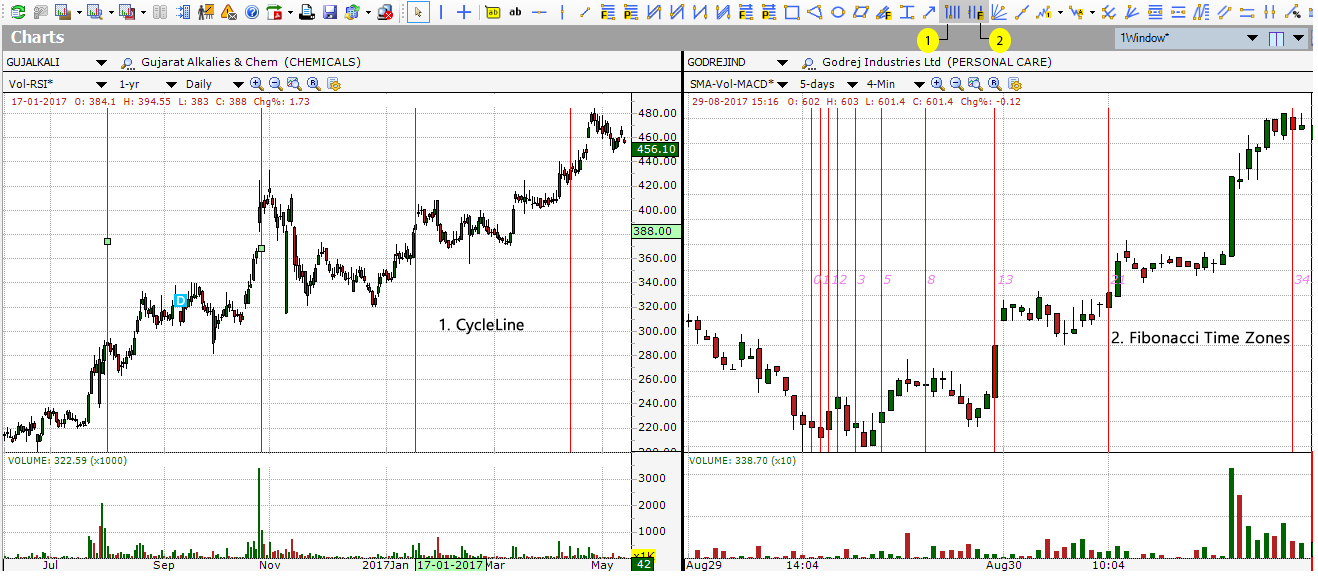
(1) The Cycle Timeline tool draws vertical lines through equal periods of time by dividing a chart into equal time periods, cycles can add significant value to the technical analysis toolset. Cycle theory asserts that cyclical forces, both long and short, drive price movements in the financial markets. This tool helps to perform cycle analysis. Cycles are not perfect though. Some will miss, some will disappear and some will provide a direct hit. This is why it is important to use cycles in conjunction with other aspects of technical analysis.
(2) Fibonacci Time Zones analytical drawing tool is represented by a series of vertical lines, and it indicates significant price movements near them. These vertical lines are spaced according to the Fibonacci number sequence (0, 1, 1, 2, 3, 5, 8…). Distances start relatively small and grow as the Fibonacci sequence extends. Analysts uses this tool to expect potential reversal points.
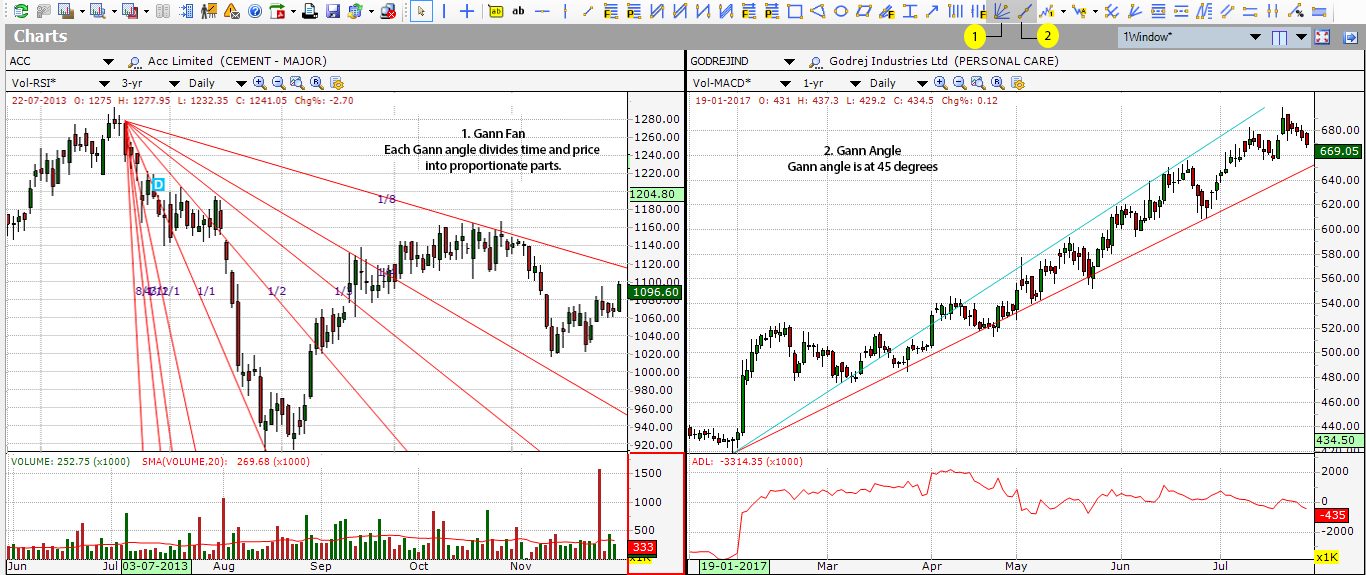
(1) A Gann Fan is drawn between a significant bottom and top (or vice versa) at various angles. A Gann fan is comprised of a series of 9 diagonal lines called Gann angles. The idea here is to use any of the fan lines as either support (when retracing an uptrend) or resistance (when retracing a downtrend). Once a support line gives, for instance, the 2X1 line, it turns into resistance, and the next one, 3X1, turns into support.
(2) A Gann angle is a diagonal line that moves at a uniform rate of speed. A trendline is created by connecting bottoms to bottoms in the case of an uptrend and tops to tops in the case of a downtrend. The benefit of drawing a Gann angle compared to a trendline is that it moves at a uniform rate of speed. This allows the analyst to forecast where the price is going to be on a particular date in the future.
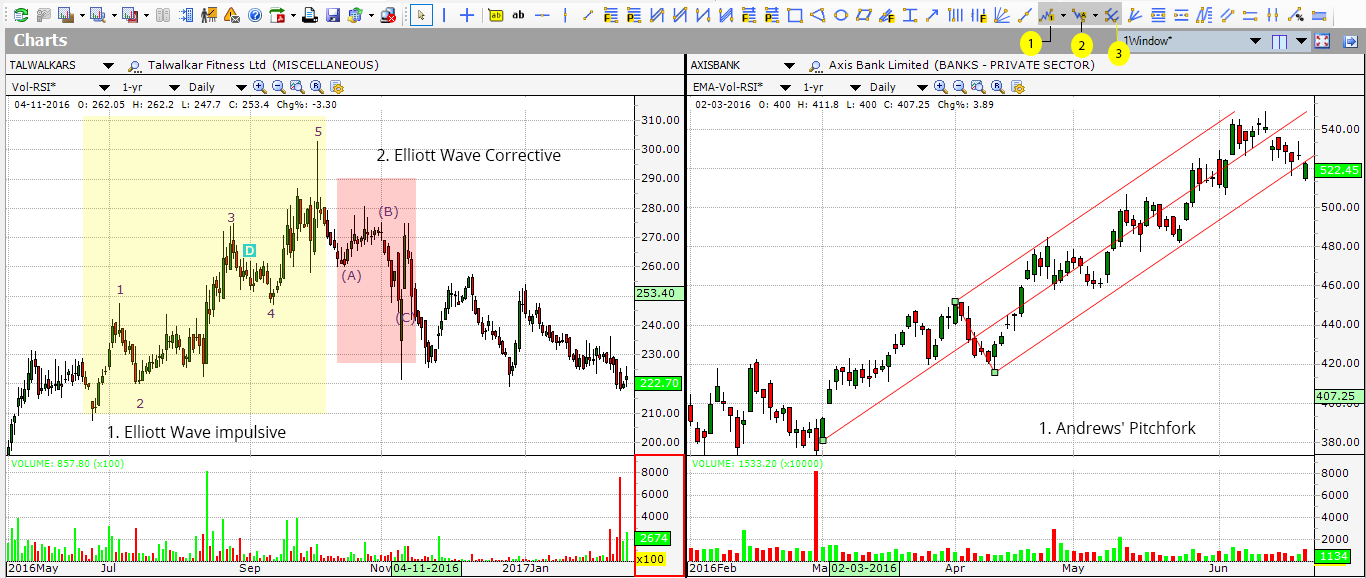 (1) Elliot Wave Impulsive is a basic 5-wave impulse sequence, allows one to mark waves in the order of 1 to 5 or Roman numerals (I, II, III, IV, V). Impulse waves move in the direction of the larger degree wave.
Elliott wave count must observe three rules: (1)Wave 2 never retraces more than 100% of wave 1. (2)Wave 3 cannot be the shortest of the three impulse waves, namely waves 1, 3 and 5. (3)Wave 4 does not overlap with the price territory of wave 1, except in the rare case of a diagonal triangle formation.
(2) Elliot Wave Corrective is a basic corrective wave which forms with three waves, typically a, b and c. Combining a basic 5 wave impulse sequence with a basic 3 wave corrective sequence yields a complete Elliott Wave sequence, which is a total of 8 waves.
(3) Andrew’s Pitchfork is an analytical drawing tool that consists of three parallel lines drawn from three user-defined points, usually major tops (resistance) and bottoms (supports). Once the points have been placed, a straight line is drawn from the first point that intersects the midpoint of the other two.
Andrew’s Pitchfork is created by selecting three points on a chart:
- A beginning point that represents the start of a trend.
- A reaction high coming after the beginning point.
- A reaction low coming after the beginning point.
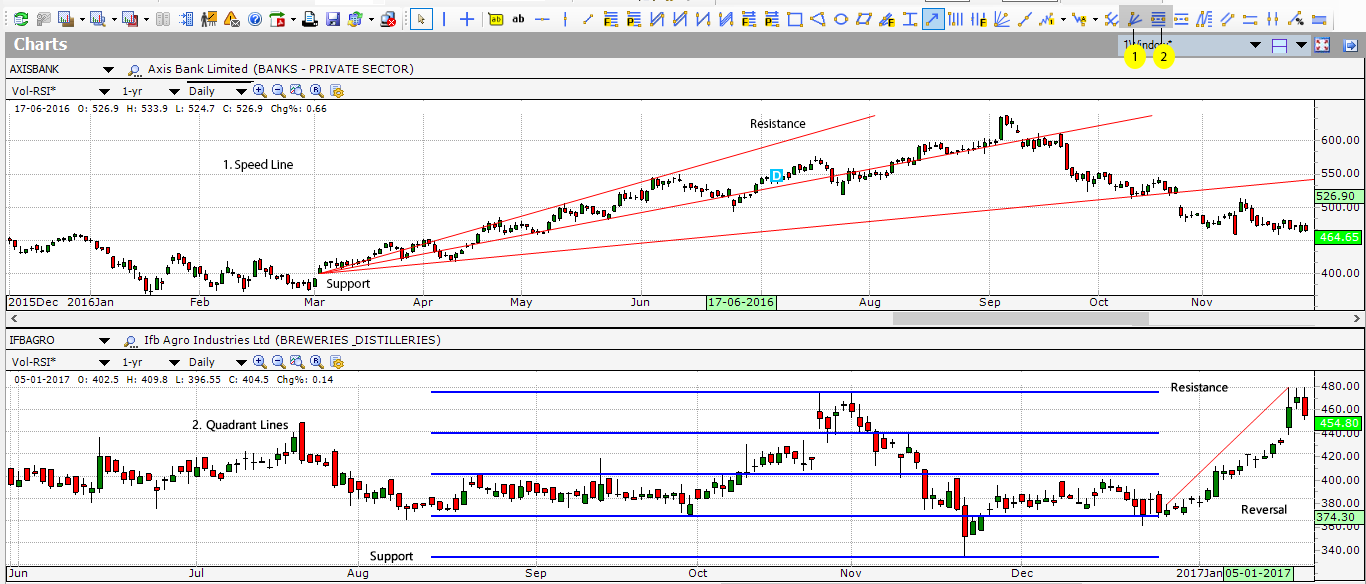
(1) Speed Lines are trend lines based on 1/3 and 2/3 retracements. They can be used to estimate support or resistance levels and to define the trend. The first line extends from the low to the high in an uptrend or from the high to the low in a downtrend. Subsequent lines are then placed at 1/3 and 2/3 intervals to estimate potential support or resistance levels.
(2) Quadrant lines are used in the same way as Fibonacci Retracements are used. Like Fibonacci Retracement, Quadrant lines have a middle line at the 50% level. The top line marks the high, the bottom line marks the low and the other three lines form the quadrants. Quadrant Lines allow traders to visually quantify price levels relative to the defined range.
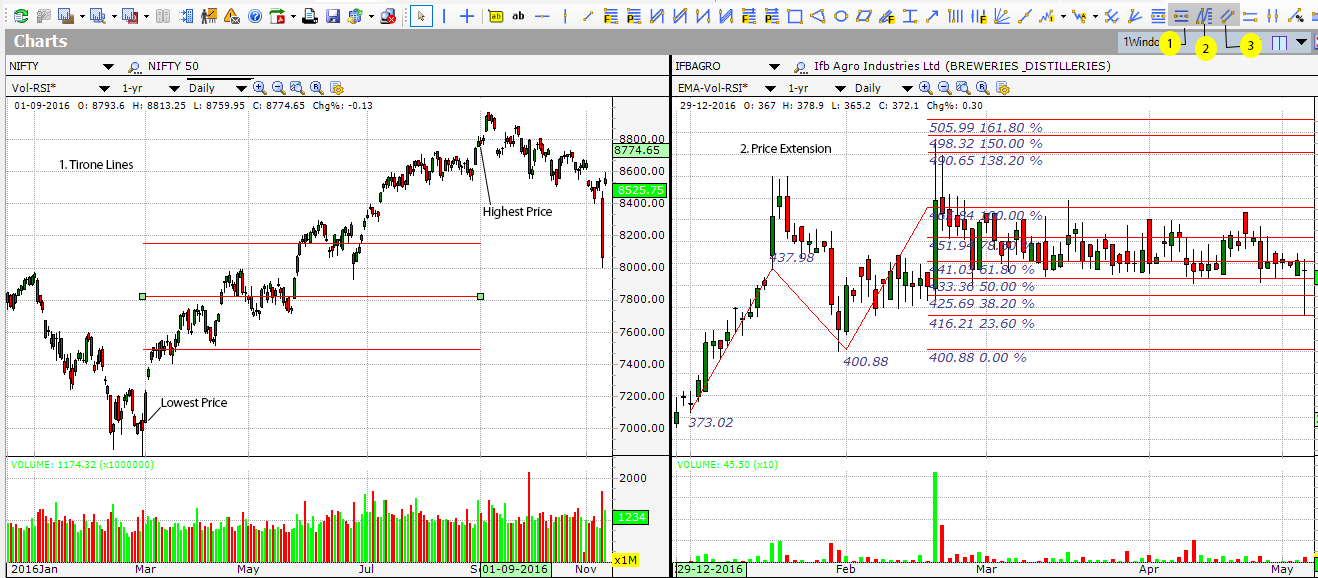 (1) Tirone lines are used to identify possible support and resistance Tirone Levels indicates possible price movements from important highs and lows. The top and bottom lines divide the range between the highest and lowest prices into thirds. The middle line shows the average price of the top and bottom lines.
(2) Price Extension is drawn over one wave of prices to provide estimates on where the next price wave will go.It is a measurement using 3 points on a chart and is the most commonly-used technique for defining profit-targets among day traders.
(3) A Parallel line is a tool used to draw a line parallel to an existing trendline. A pair of parallel lines can be used to outline the equidistant channel in which the market trades.