On-balance volume (OBV) is a technical analysis indicator which is designed to correlate price and volume in the stock market. OBV measures buying and selling pressure as a cumulative indicator that adds volume on up days and subtracts volume on down days. When the security closes higher than the previous close, all of the day’s volume is considered up-volume. When the security closes lower than the previous close, all of the day’s volume is considered down-volume.
How this indicator works
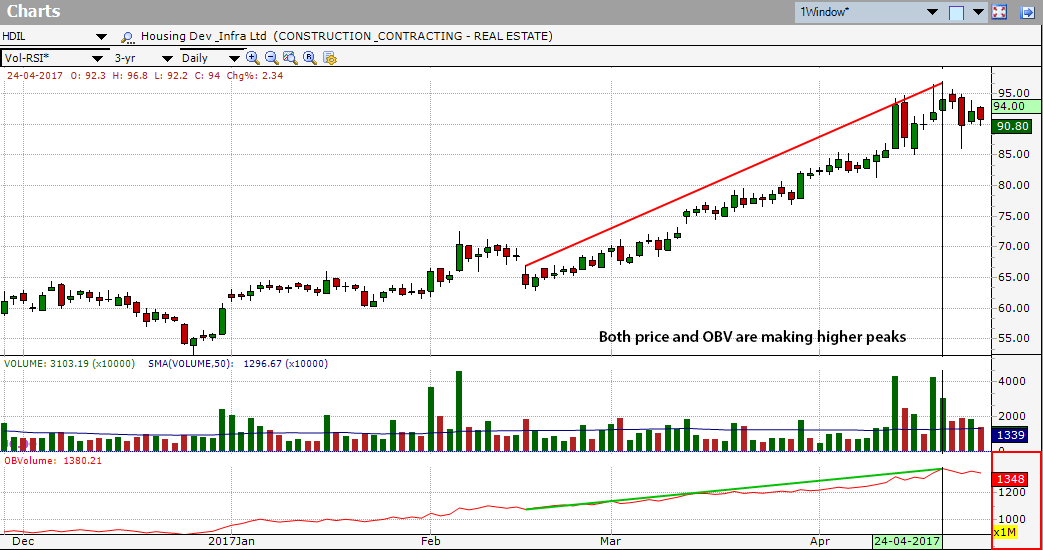
- When both price and OBV are making higher peaks, the upward trend is confirmed.
- When both price and OBV are making lower peaks, the downward trend is likely to continue.
- During a trading range, rising OBV indicates accumulation and hence chances of upward breakout.
- During a trading range, falling OBV indicates distribution and hence chances of support breakdown.
- When price continues to make higher peaks and OBV fails to make higher peaks, the upward trend is likely to stall or fail. This is called a negative divergence.
- When price continues to make lower troughs and OBV fails to make lower peaks, the downward trend is likely to stall or fail. This is called a positive divergence.
Calculation of On-balance volume (OBV)
If today’s closing price is greater than the yesterday’s closing price then
Today’s OBV = Yesterday’s OBV + Today’s Volume
If today’s closing price is less than the yesterday’s closing price then
Today’s OBV = Yesterday’s OBV – Today’s Volume
And if Today’s close is equal to Yesterday’s close then
Yesterday’s OBV = Today’s OBV
Divergence Trade
Bullish divergence signals are useful to predict a trend reversal. A bullish divergence forms when OBV moves higher or forms a higher low even while prices move lower.
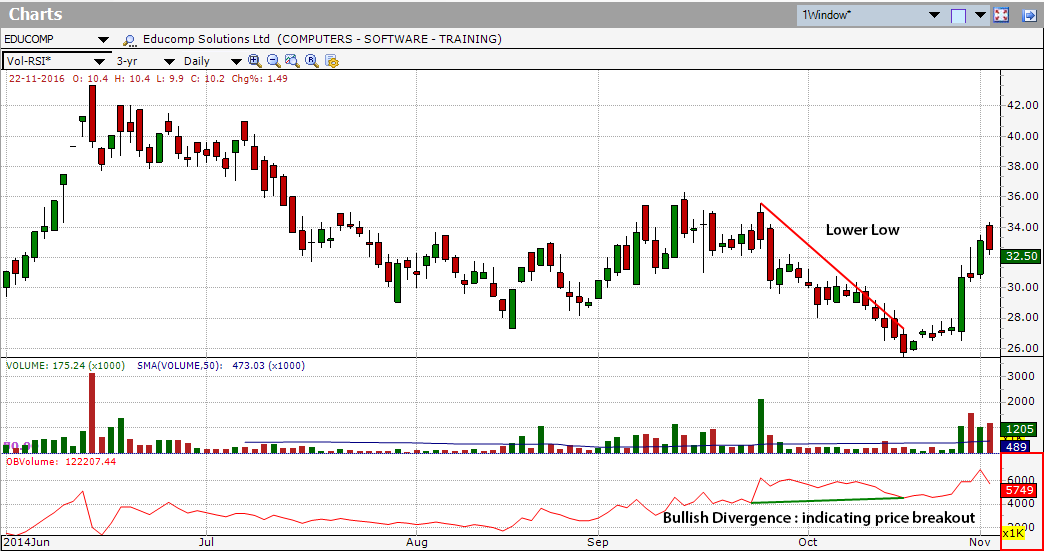
The chart for Educomp Solutions Ltd (EDUCOMP) shows a bullish divergence forming in September. After pinpointing the divergence, the trade is setup. The exit point of this trade is when price gets to oversold levels as identified by the OBV.
A bearish divergence forms when OBV moves lower or forms a lower low even as prices move higher. The divergence between OBV and price should alert trader that a price reversal could be in the making.
OBV Breakout
Volume precedes price. OBV helps in understanding the accumulation and distribution pattern and helps in identifying breakout and breakdown in near future. Rising OBV during a trading range indicates accumulation, which is bullish. Also OBV in trading range indicates distribution which is bearish.
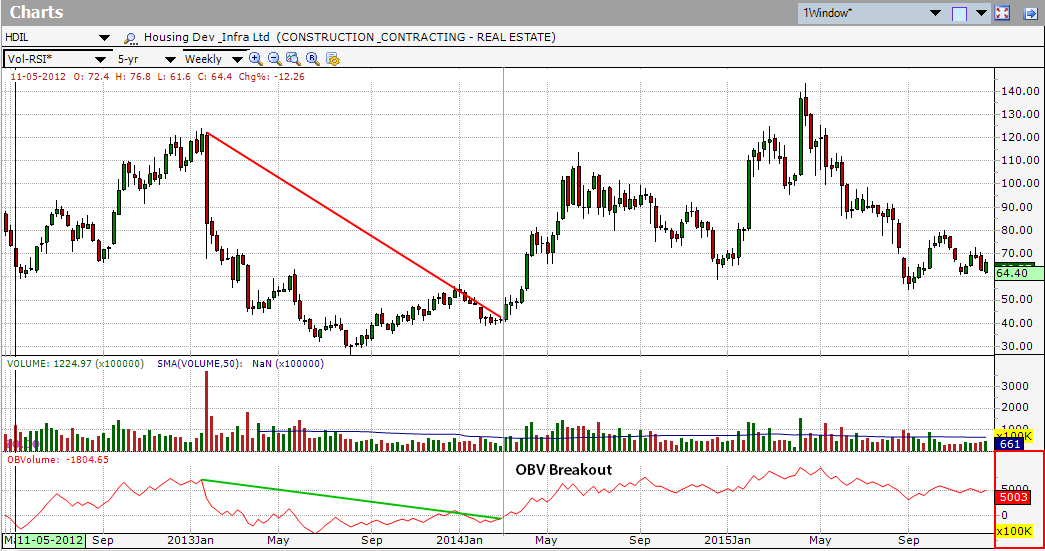
OBV can be used to confirm a price trend, upside breakout or downside break. The chart for Housing Dev infra ltd (HDIL) shows confirming signals as well as confirmation of the price trend. Notice how HDIL broke it’s down trend line in late February and OBV confirmed with a breakout in March.
Overall the OBV is a useful indicator to confirm movements in price and identify potential reversals. As with all indicators, it is best to use OBV with additional technical analysis tools.