A pivot point is a technical analysis indicator used to determine support and resistance. A pivot point is calculated based on OHLC (Open, High, Low, and Close) Data. Today’s intraday levels are based on previous day’s OHLC data.
If the market in the following period trades above the pivot point it is usually evaluated as a bullish sentiment, whereas trading below the pivot point is seen as bearish. Pivot points are commonly used intra-day indicators for stocks, trading futures and commodities.
Types of pivot points
Pivot Levels can be calculated based on Classic, Camarilla or Woodie based formulae.
Pivot Points are theoretical support and resistance levels based on the previous day’s open, high, low and close values: PP, R1, R2, R3, S1, S2, and S3. PP is the Pivot Point, R1, R2 and R3 are resistance levels, and S1, S2 and S3 are support levels.
How to draw Pivot levels
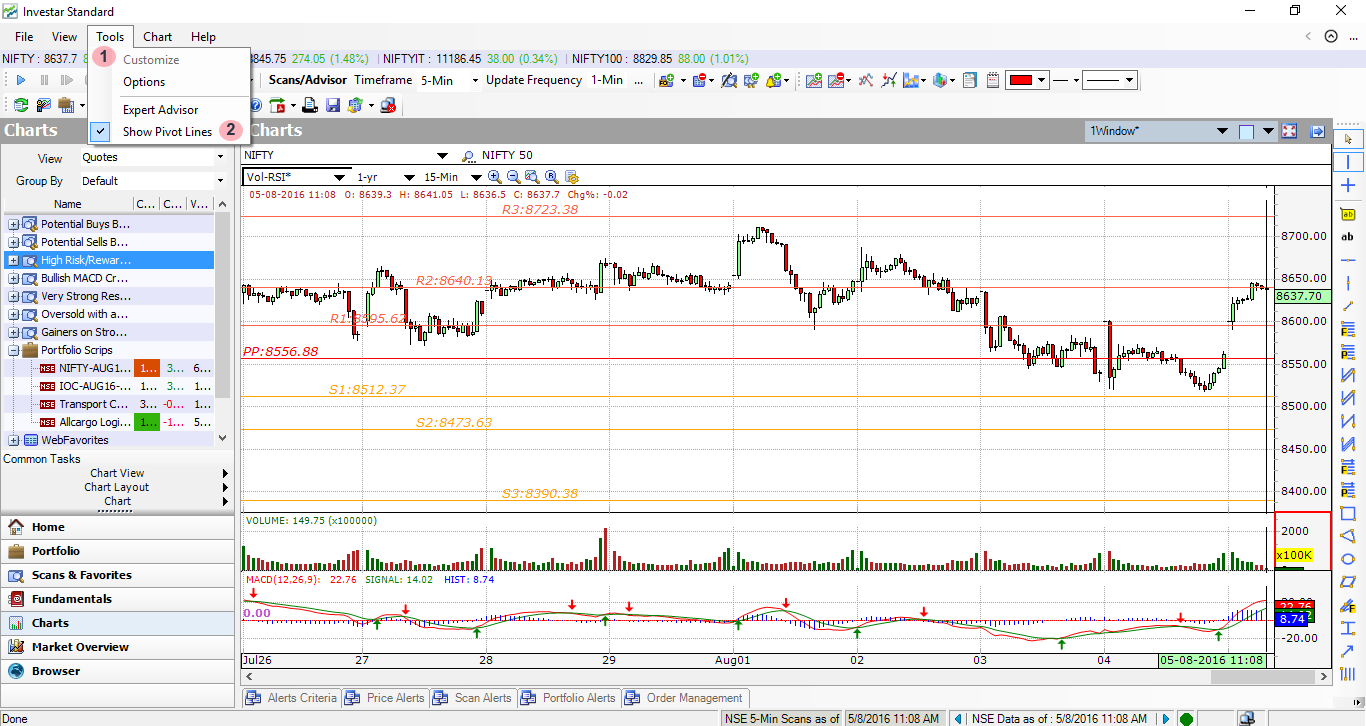
Click on the (1) Tools from Main Menu and (2) select Pivot Points from the list.
How to configure different Pivot Points
(1) Select Tool from Main Menu and (2) select Option from the list.On the pop-up window, simply select from Drop-down box.

Classic Pivot Points
This is a simple average of the high, low and close. The first and most significant level of support (S1) and resistance (R1) is obtained by recognition of the upper and the lower halves of the prior trading range, defined by the trading above the pivot point (H − P), and below it (P − L).
| Pivot Point (pp) = (h + l + c) / 3; | Resistance (r2) = pp +(r1 – s1);
Support (s2) = pp – (r1 – s1); |
| Resistance (r1) = 2 * pp – l;
Support (s1) = 2 * pp – h; |
Resistance (r3) = pp + 2 * (h – l);
Support (s3) = pp – 2 * (h – l); |
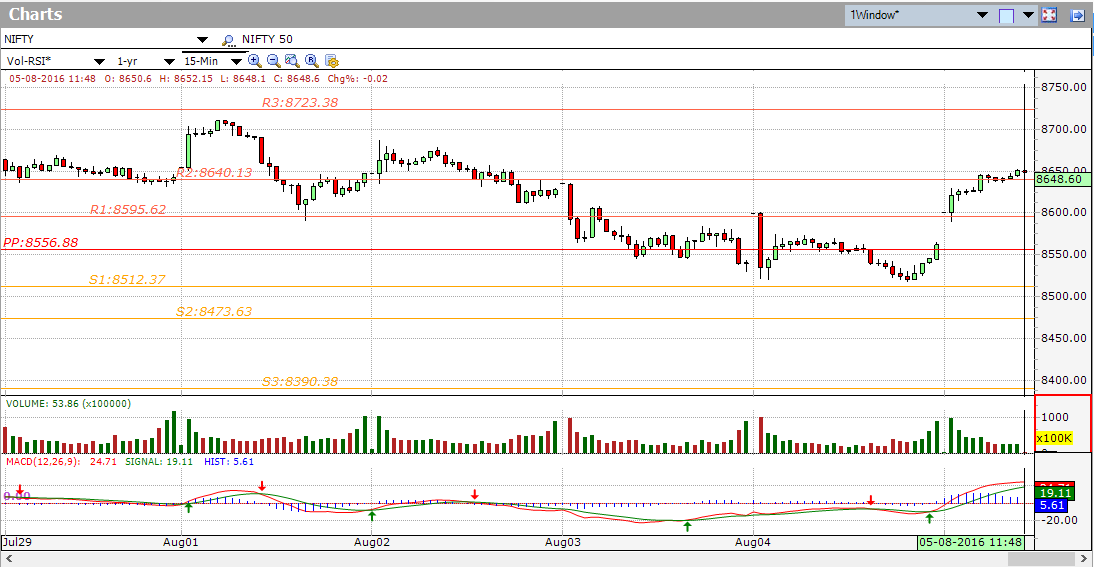
The chart below shows Nifty 50 (Nifty) with Standard Pivot points on a 15 minute chart. The Pivot Point is in the middle, the support levels (S1, S2, and S3) are below and the resistance levels (R1, R2 and R3) are above.
Camarilla Pivot Points
Camarilla pivot point formula is the improved form of existing classic pivot point formula. This formula uses the range of the given time frame, daily, weekly, monthly etc. Camarilla equations take previous day’s high, low and close as input and generates levels of intraday support and resistance based on pivot points.
| Pivot Point (pp) = (h + l + c) / 3; | Resistance (r2) = c + (h – l) * 1.1d / 6;
Support (s2) = c – (h – l) * 1.1d / 6; |
| Resistance (r1) = c + (h – l) * 1.1d / 12;
Support (s1) = c – (h – l) * 1.1d / 12; |
Resistance (r3) = c + (h – l) * 1.1d / 4;
Support (s3) = c – (h – l) * 1.1d / 4; |
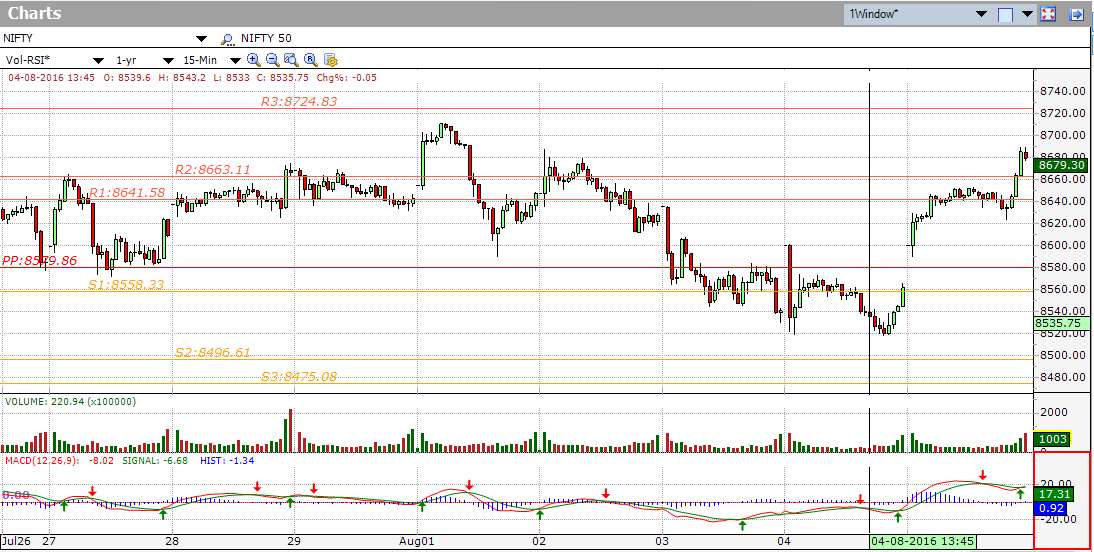
The chart below shows the Nifty 50 (Nifty) with Camarilla Pivot points on a 15 minute chart. The Pivot Point is in the middle, the support levels (S1, S2, and S3) are below and the resistance levels (R1, R2 and R3) are above.

Woodie Pivot Points
Woodie pivot points are similar to classic pivot points; the only exception being that Woodie overlooks the close price of the previous day and gives more prominent to the open price of the current day.
| Pivot Point (pp) = (h + l + o + o) / 4; | Resistance (r2) = pp + (h – l);
Support (s2) = pp – (h – l); |
| Resistance (r1) = 2 * pp – l;
Support (s1) = 2 * pp – h; |
Resistance (r3) = h + 2 * (pp – l);
Support (s3) = l – 2 * (h – pp); |
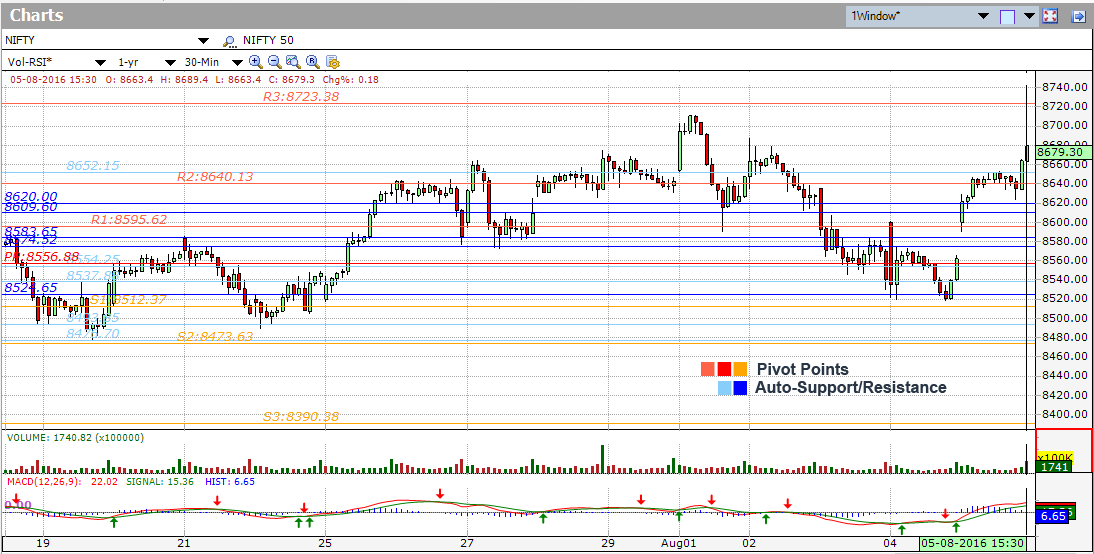
The chart below shows the Nifty 50 (Nifty) with Woodie Pivot points on a 15 minute chart. The Pivot Point is in the middle, the support levels (S1, S2, and S3) are below and the resistance levels (R1, R2 and R3) are above.
Pivot points are based on theoretical calculations to help spot support and resistance levels. However, the accuracy varies from stock to stock and they perform better on heavily traded stocks probably on the premise that other traders use them. However, they are not based on the actual supply/demand in the stock price. To get the support/resistance levels due to actual supply/demand, you need to manually draw the support/resistance levels on the chart through peaks and troughs in the chart. An easier way to do it, however, would be to use the recently-launched Auto-Support/Resistance feature of Investar which uses Artificial Intelligence to plot the Support/Resistance levels based on the peaks and lows in the price chart, just as an expert Technical Analyst would. Identifying support/resistance levels is the first step in identifying possible breakout trading opportunities. You can see the video here. More in-depth comparison of pivot points and Auto-SR as a strategy is also given in this Support/Resistance Strategies webinar.
As can be seen in the chart below, the Pivot Levels missed a major resistance, 8657, which was identified by the Auto-SR feature!
Read More on How to use Pivot Points for Intraday Trading.
Want to use Pivot Points to improve your trading?
Click on the button below to download a Free 7-day trial of Investar:
![]()
It is nice !
Please add CPR pivot, it’s very very powerful, refer pivot boss book
Thanks for your feedback, we will definitely consider this for a future version.
there is no central pivot range in software
please include
Thanks for your feedback, we will definitely consider this for a future version.