Average True Range – ATR
Average true range (ATR) is a technical analysis volatility indicator originally developed by J. Welles Wilder, Jr. for commodities. Unlike many of today’s popular indicators, this indicator does not provide you with a signal of price trend, merely the degree of price volatility specifically volatility caused by price gaps or limit moves. The ATR is fairly simple to calculate and only needs historical price data.
Average True Range is simply an average of the true range- usually 14-days. Computing the Average True Range Indicator is somewhat challenging, though it can be done with a spreadsheet. Fortunately, most of the stock trading software (including Investar) provide the average true range indicator as a part of their service.
ATR Calculation
To calculate the ATR, the True Range first needs to be figured out. True Range considers the most current period high/low range along with the previous period close if necessary.
To find the True Range, take the greatest of the following:
Current High minus (-) the Current Low
Current High minus (-) previous Close (absolute value)
Current Low minus (-) previous Close (absolute value)
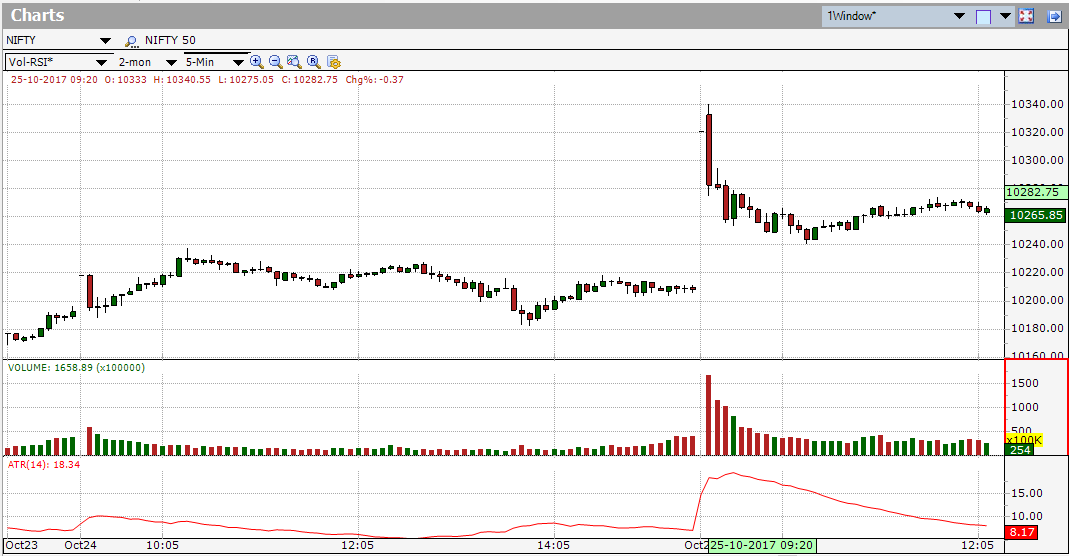
Absolute values are used to ensure positive numbers. The ATR can be calculated for, and applied to, any chart timeframe, such as 1-minute charts, hourly charts or weekly charts. When using intra-day charts, such as a 5-minute chart, there may be big swings in the ATR near the open whenever there was a gap in price overnight. As the day progresses the ATR would probably settle down and indicate the movement for just that trading day.
How this indicator works
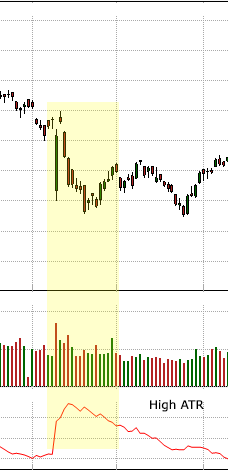
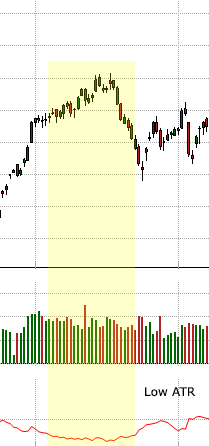
Average True Range is not necessarily a trade signal, although it can be used to assist and confirm entry points. The value returned by the Average True Range is merely an indication as to simply how much a stock has moved either up or down on an average over the defined period. High values signify that prices are changing a large amount during the day. Low values signify that prices are staying relatively steady.
The ATR (Average True Range) indicator also helps to figure out the average size of the daily trading range. In a nutshell, it explains how volatile the market is and also how much does it move from one point to another throughout the trading day.
ATR is not a leading indicator – means it will not send signals regarding market direction or duration, however it gauges one of the most important market parameter – price volatility. There is absolutely no level that indicates a stock is about to reverse, or that a trend will continue. Instead, current ATR readings must always be compared to prior readings to get a sense of trend strength or weakness.
Average True Range (ATR) really should not be used as an independent signal yet is beneficial in confirming moves and in timing trades. Use ATR to ascertain when volatility is increasing and when it will be contracting; this could help out determine the best times to trade. A strong move in either direction with an increase in ATR values confirms the direction of the movement. Hence if a resistance breakout or support breakdown is accompanied by an increase in ATR values, it gives more confidence in the breakout or breakdown.