In a previous post, we had explained about the two main type of technical indicators: oscillators and trending indicators, giving an example of an oscillator (RSI) and a trending indicator (EMA) and shown the reader how the Buy/Sell signals occur in each. Each of the indicators have there pros and cons, but which one is better to use? Rather than using one or the other, in this blog post we will talk about a strategy where we show how a combination of an oscillator and a trending indicator can be used to greatly minimize false signals.
Since an oscillator (RSI) gives early signals of trend change and a trending indicator (say EMA crossover) gives late signals, we can use a simple combination of an RSI followed by an EMA crossover to try to eliminate false Buy/Sell signals and as a better indication of a change in trend.
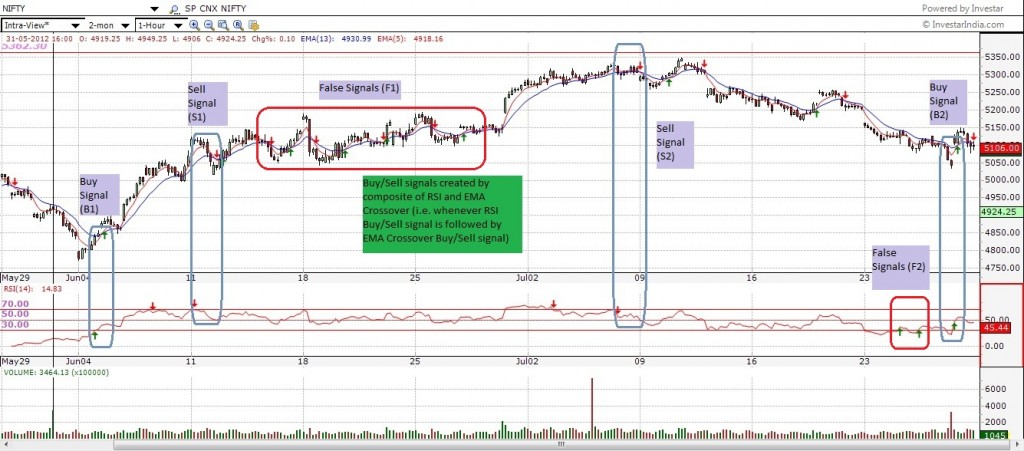
The strategy is as follows: Whenever an RSI Buy signal is followed by an EMA crossover Buy signal, we treat it as a Buy signal and vice versa whenever an RSI Sell signal is followed by an EMA Crossover Sell signal, we treat it as a Sell signal. This is illustrated in the following 1-hour intraday chart of Nifty, where the Buy and Sell signals used after combining both RSI and EMA crossover are highlighted. When using this strategy we effectively ignore any RSI signal, if it is not followed by a similar EMA Crossover signal within a few bars. We also ignore any EMA crossover signal if there was no preceding RSI signal a few bars back. In short, what you have to do is group all the signals where an RSI was followed by an EMA crossover and those are your Buy/Sell signals.
If shown in the chart,
B1,B2: Composite Buy signals (where RSI Buy signal was followed by EMA crossover Buy signal)
S1,S2: Composite Sell signals ( where RSI Sell signal was followed by EMA crossover Sell signal)
F1, F2: False signals (where either RSI or EMA crossover Buy/Sell signal occured but not both)
No Technical Analysis strategy can be perfect and the same holds for this one also. So it is also important to know its limitations. Although this strategy does not guarantee that you won’t get a false signal, but atleast it helps reduce a lot of false signals (e.g., just see the false signals labelled F1 in the chart to see how we could ignore many EMA crossover Buy/Sell signals that occured between S1 and S2. Another thing to note is that whenever you use a combination of two indicators, you will sometimes miss correct signals (but if you are a trending trader who trades based on a trend, this is a much better situation because it is better to miss out on a trade then to enter a wrong trade (:- .
So if you wanted to follow this strategy within Investar, how would you do it? In Investar, you can use a combination of the intraday screener and scan alerts feature to find stocks that are showing these signals. Start with any of the overbought/oversold RSI scans to identify stocks that are having RSI Buy/Sell signals (e.g., “Overbought with an Improving RSI” and “Oversold with a Declining RSI”). Navigate to the chart and if you like the chart, set a scan alert on any of these stocks for Bullish/Bearish EMA crossover signals. Whenever Investar detects a EMA crossover on these stocks at a later time, you can then decide if you want to take the trade if it is happening within a few bars.

Excellent
How many days EMA crossover shall be used with RSI. Do we look have to volume also while using this strategy.
RSI with EMA-5-20 crossover works fine, but you could also try other different EMA parameters. See this post to see how to choose EMA parameters.
nice written