Harmonic Patterns take geometric price patterns to the next level by utilizing Fibonacci numbers to define precise turning points. Unlike other more common trading methods, harmonic trading attempts to predict future movements. By identifying PR Zones, one can even get precise targets and stop-losses.
In this article we will learn about what Harmonic Patterns are and how they are primarily used for trading.
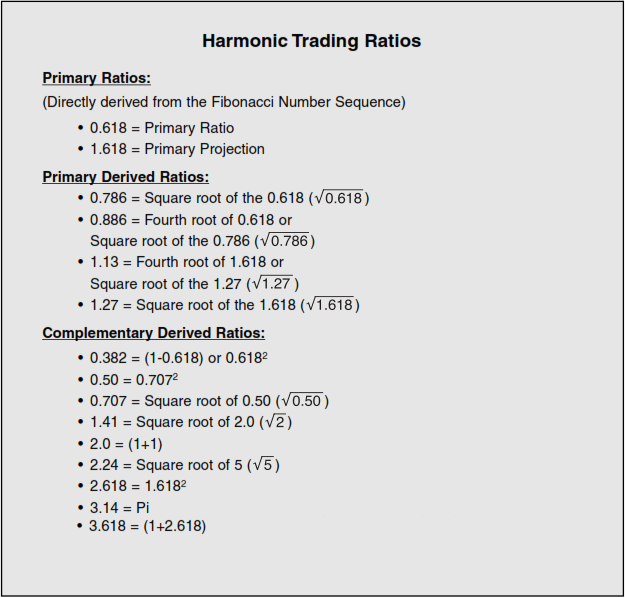
But, first, we need to understand the key Fibonacci ratios that form an integral part of these Harmonic Patterns. The following are the key Fibonacci ratios that are used in Harmonic Patterns:
ABCD Pattern
The ABCD pattern is the simplest harmonic pattern where the AB leg = CD leg as in the following figure:
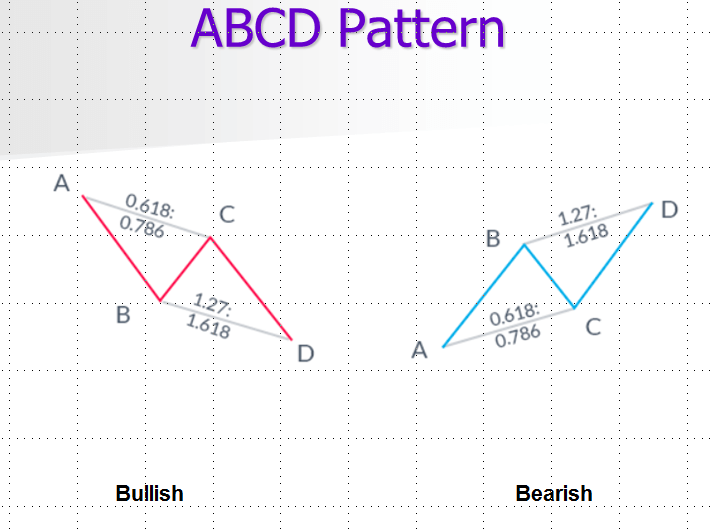
Here:
BC = 0.786*AB to 0.618*AB
CD = 1.27*BC to 1.618*BC
XABCD Pattern
Most of the Harmonic Patterns however have 4 legs starting from X to form an XABCD pattern. The following figure shows how you can read a generic XABCD Harmonic Pattern:
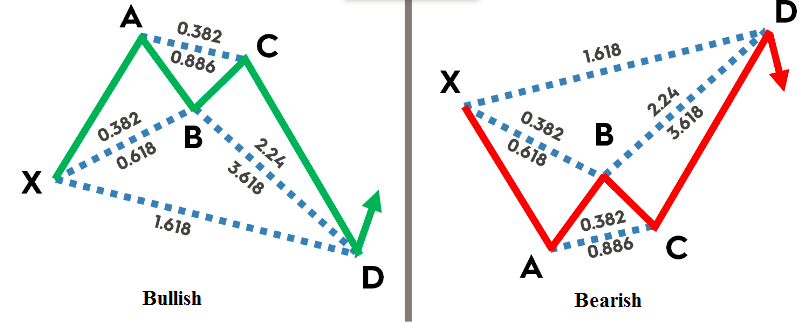
The way to interpret the Fibonacci ratios above and their exact relationship to each of the legs is as follows:
AB = 0.382*XA to 0.618*XA
BC = 0.382*AB to 0.886*AB
CD = 2.24*BC to 3.618*BC
AD = 1.618*XA
As you can see, if a Harmonic Pattern is M-shaped, then it is usually a bullish pattern, while if it is W-shaped, then it is a bearish pattern.
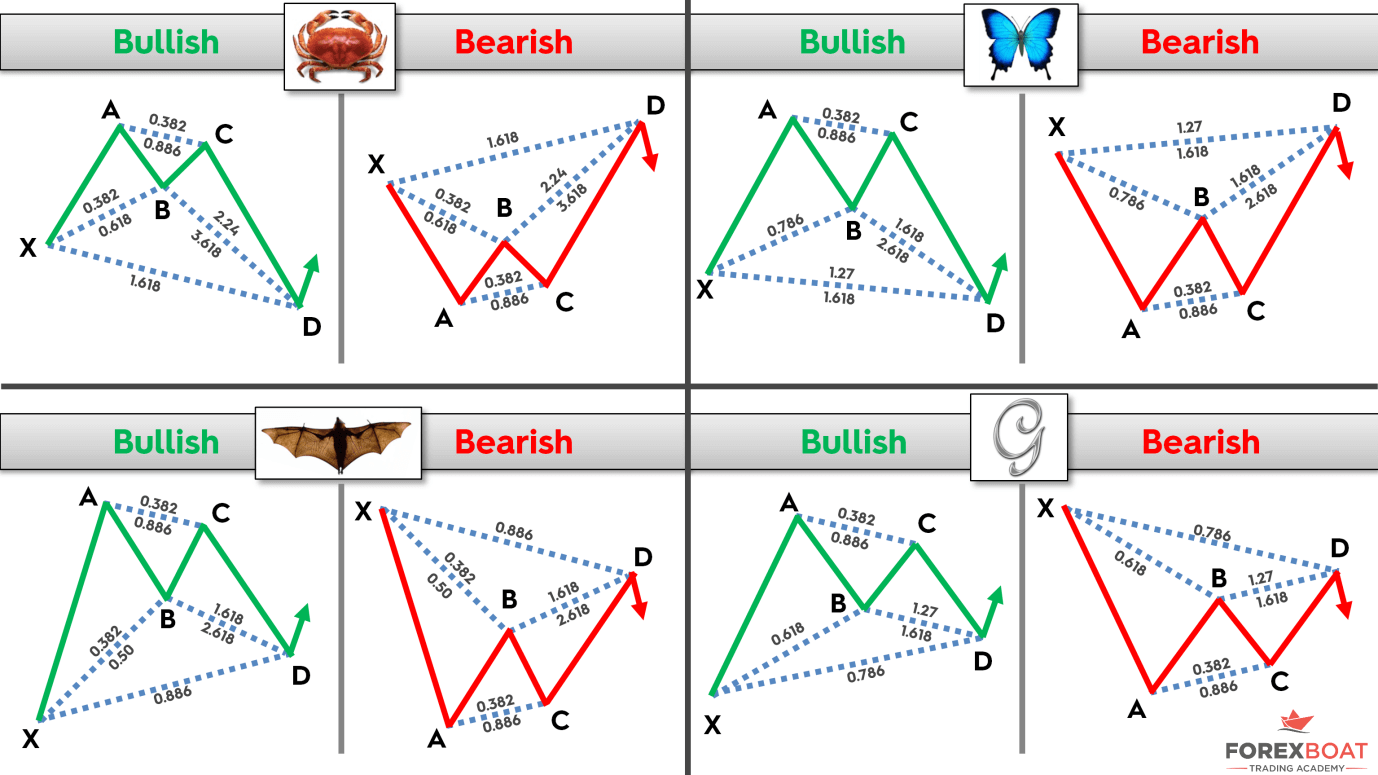
Some common Harmonic Patterns are the following:
- Crab
- Gartley
- Butterfly
- Bat
The picture below (courtesy: Forexboat Trading Academy) shows the summary of all the above Harmonic Patterns along with the relationship of each leg of the Harmonic Pattern to each other.
Investar makes it easy to use Harmonic Patterns without remembering the details of how each Harmonic Pattern is formed. This is because of the Auto-Harmonic Patterns feature, where all the Harmonic Patterns are automatically detected by the software.
To enable Auto-Harmonic Patterns, you simply right-click and check “Auto-Harmonic Patterns -> Enable Auto-Harmonic Patterns” and the software will show the bullish patterns in green and bearish patterns in red as shown in the screenshot below:

As you can see in the screenshot above, the majority patterns predicted the reversals properly (e.g. the red-shaded Butterfly pattern ending on 20 Jan-20 correctly predicted the downtrend in Nifty).
We can even get precise targets and stop losses using Harmonic Patterns, but that we will cover in a future blog post.
Want to try out this Auto-Harmonic Patterns feature?
Click on the button below to download a Free 7-day trial of Investar:
![]()
One Reply to “Harmonic Patterns – An Introduction to Harmonic Trading”