Today we will be looking at an Intraday Volume Breakout Trading Strategy for 2-3% gains. Here we will not only look at potential entry points but also exit points for maximum gain.
Profitable Intraday Trading depends on both when you enter the stock and when you exit the stock. We will look at both of these separately with a concrete example of a stock, Dolphin Offshore Limited (DOLPHINOFF) which gave 4% gains in intraday on 11th Jan 2019.
Intraday Trading Strategy using Volume Breakout
How to Enter
To enter a stock using this strategy, we will do so when a stock breaks out of a very strong resistance on high volume.
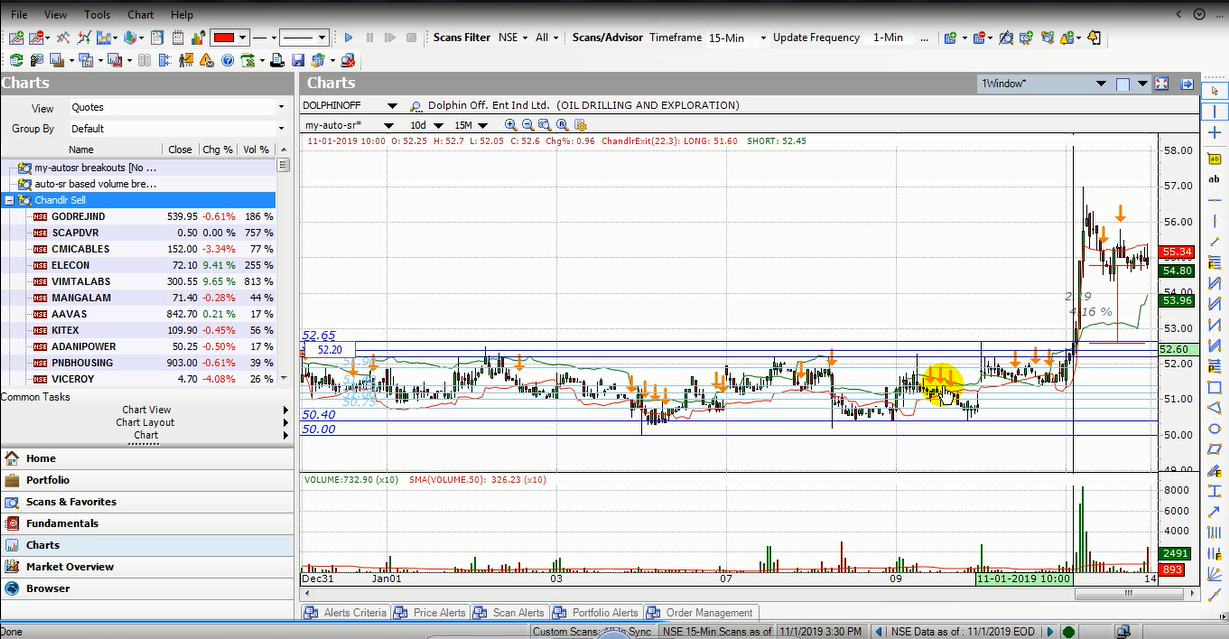
To find those potential entry points, right click on the DOLPHINOFF chart in Investar software and click on “Enable Auto SR”. This draws the support/resistance lines using Auto-Support/Resistance feature which uses AI to automatically plot the support/resistance levels as if they were drawn by an expert Technical Analyst. The dark blue lines are very strong resistance lines and any break of that can be considered a stronger buy signal compared to a light blue one.
However, we want to look at the situation when the volume breakout happened, and for that we will use a very useful visual back-testing feature of Investar. After right clicking on the chart again and selecting Auto S/R Options and then again on Auto S/R based on current cursor, you can see the resistance lines changing with the cursor. This shows the exact support/resistance lines wherever the cursor is.
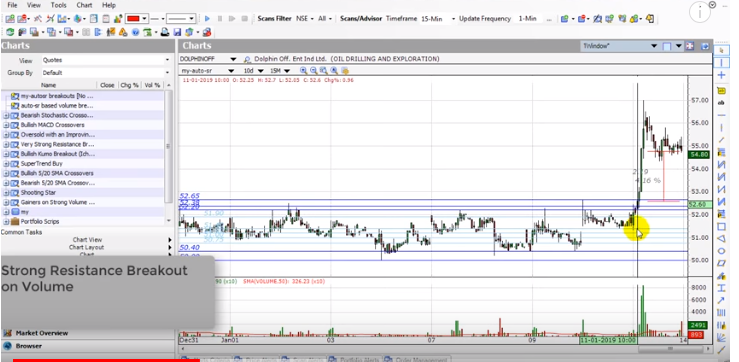
We can see that there was a resistance breakout with volume around 10 am which then resulted in a 4.16% spike. But not every volume breakout can result in such gains. To ensure that you do not end up with a false breakout, always ensure that there is a sideways trend for 2 days prior to the breakout. e.g., if you look at the figure below, there is a sideways trend for at least 2 days prior to the breakout.
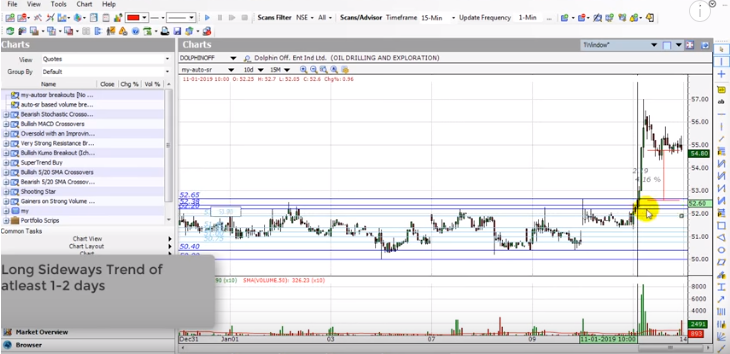
Considering this stock, we have seen when to enter at 52.6, and how ensuring a prior sideways trend can maximize success. To summarize the entry:
- Buy when a stock breaks out of strong resistance on high volume.
- Ensure there is a sideways trend of atleast 2 days.
For more details, check out our video on “Intraday Volume Breakout Strategy” for an in-depth look into this topic :
In Hindi
In English
How to exit
Now, a profitable intraday trading strategy depends not only on when to enter, but also on when to call it a day.
To exit the stock, we will use the Chandelier Exit indicator which is basically an ATR-based stop/loss. Using the “Create Custom Scan” button, we can create a custom scan based on “Chandelier Exit” as shown in the screenshot below:
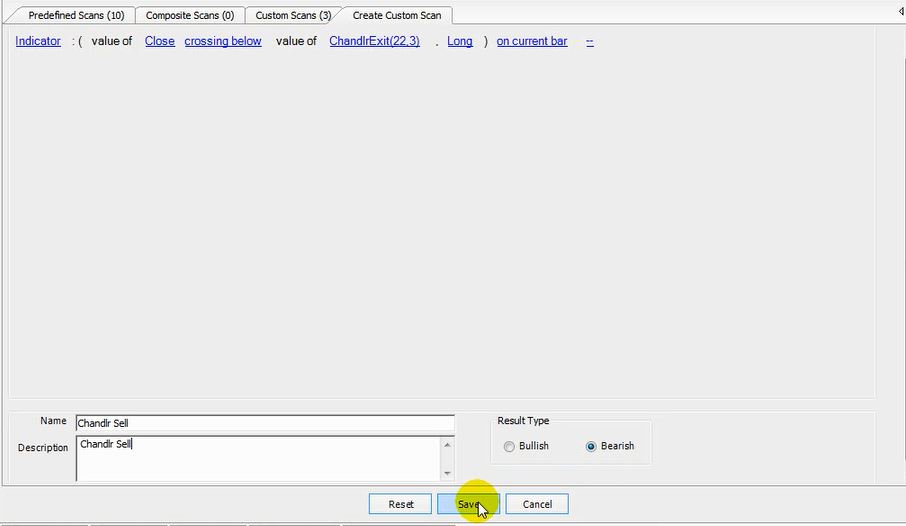
As soon as we press the “Save” button, on the left-hand side of our screen, we will find results of the “Chandlr Sell” custom scan as shown in figure below.
However, our focus will be to understand signals based on the chart. Click on “Buy/Sell” option, and configure the sell option by clicking on “Chandlr Sell” just created few moments ago.
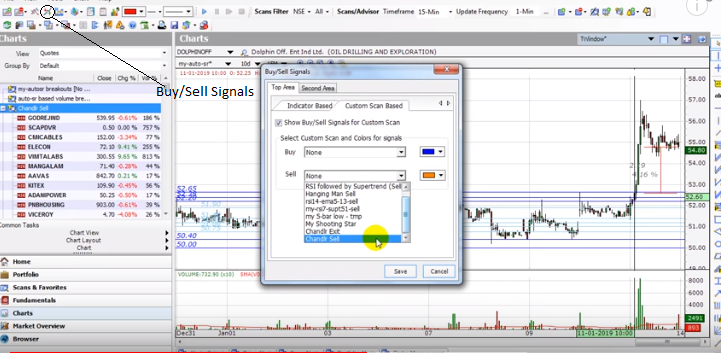
Once you do that, you can see Orange Sell signals on the chart, and upon closer inspection you will find the closing price, and the selling point according to “Chandlr Sell” is approximately close to each other and giving us a gain of 4.16%. The exit point is hinted earlier than what the close price originally was, giving us an advantage in time.
Now, running the same on ICICI Prudential stock we find that the Chandelier exit is not given, so in such cases we have to exit just before the market closes. Below figure shows 5.23% gain, but no such exit points.

How to scan stocks for this intraday trading strategy
Now let’s find out how we can identify stocks for this intraday trading strategy. For that, we click on “Manage Scans”, and click on “Potential Buy Breakouts” scan in the “Composite Scans” tab.
During the day you simply have to monitor this scan in the 5-min and 15-min timeframes (for example) to find stocks that are doing a volume breakout and then apply this intraday trading strategy.
Now, you can also set a “Scan Alert” based on “Chandelier Exit” by right clicking on the stock and selecting “Set Scan Alert”, and get notifications for the sell signals on your desktop as well as mobile, if you are using the Investar Android App.
The blog focuses on the best intraday strategy by identifying potential entry and exit points for day trading stocks profitably. Volume Breakout identification is no rocket science, and it just takes a few minutes to identify it. Till the next blog, trade well!
Want to try out this intraday trading strategy?
Click on the button below to download a Free 7-day trial of Investar:
![]()
Hi, I have an apple computer, Have asked this question two year back too, do you have a software for Apple computers?
We don’t have any separate version for Mac. You can use Boot camp or Parallels to run Windows on a Mac and then install Investar on that. This is a common way to run Windows software on a Mac.