We are pleased to release the Investar 6.1 release with the following features:
- Mutual Funds
- Auto-Divergence Custom Scans
- More robust Multi-timeframe query
- All Broad-based, Sectoral and Thematic NSE & BSE Indices
- Support for Custom Favorite Views
- Only Buyers/Sellers Scans (for finding Circuit Breakers)
- New UI Look and Improved Watchlist management.
- New Indicator: Anchored VWAP
- Support for color, thickness and dashedness for Auto-Trendlines and Divergence lines
- Support for Zerodha XML Contract notes.
- And many more
Here is a summary of how to use the key features:
Mutual Funds
Did you know that Technical Analysis can be applied to Mutual Fund charts? If you are investing in Mutual Funds or in a SIP (investing in Mutual Funds), you can now perform Technical Analysis on Equity and Hybrid Mutual Funds and decide when to buy or sell your favourite Mutual Fund. All you need is our new Mutual Funds Add-On.
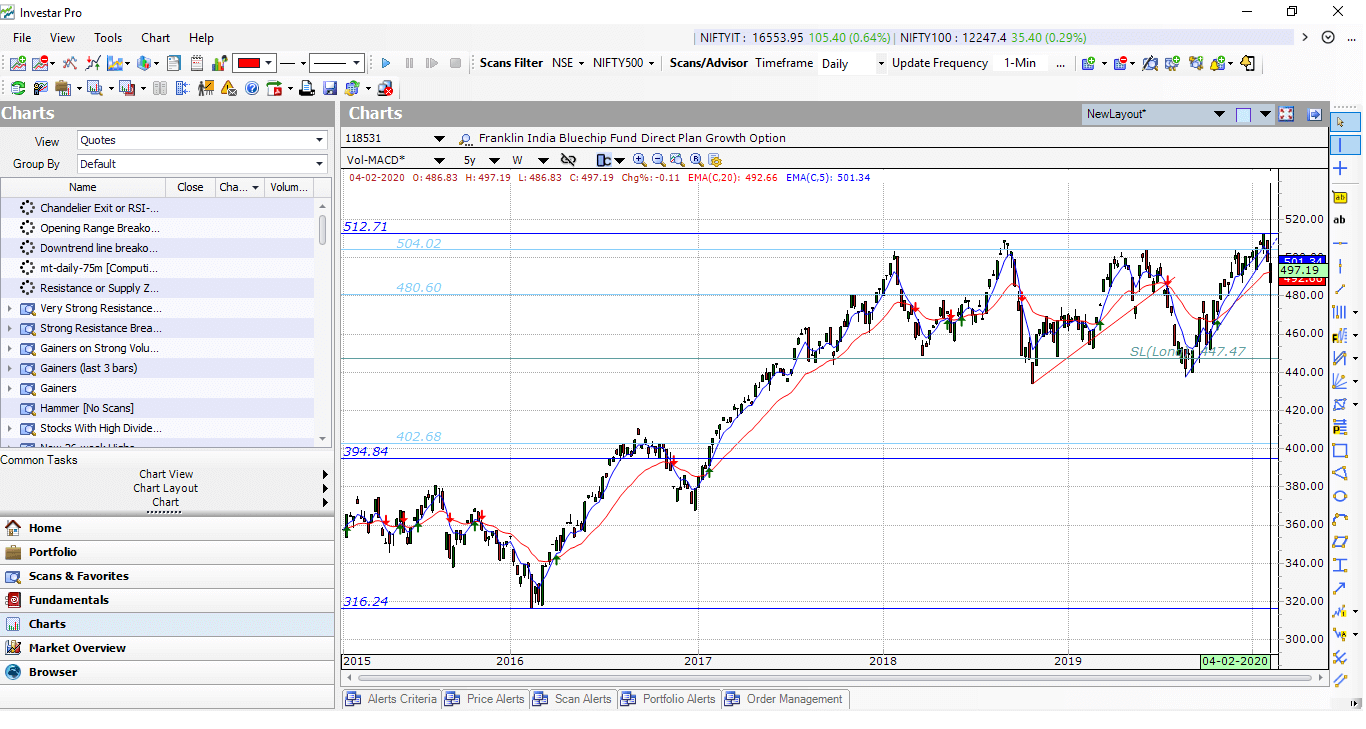
Here is a screenshot of a Franklin Templeton Fund where you can not only see simple EMA crossover based Buy/Sell signals on Mutual Funds working well but also the Auto-Trendline feature giving a perfect trendline:
You can also scan for Mutual Funds with your favourite Technical criteria. Here is an example of a simple EMA-5-20 crossover scan applied on all Mutual Funds:

Auto-Divergence Custom Scans
Divergence is where the price of a stock and a set of relevant indicators, e.g., the MACD, stochastic oscillator, RSI, etc… are moving in opposite directions.
Now you can scan for stocks showing Divergence between Price and RSI, Price and CCI, Price and Slow Stochastics and Price and MACD for Regular and Hidden Bullish and Bearish Divergences.
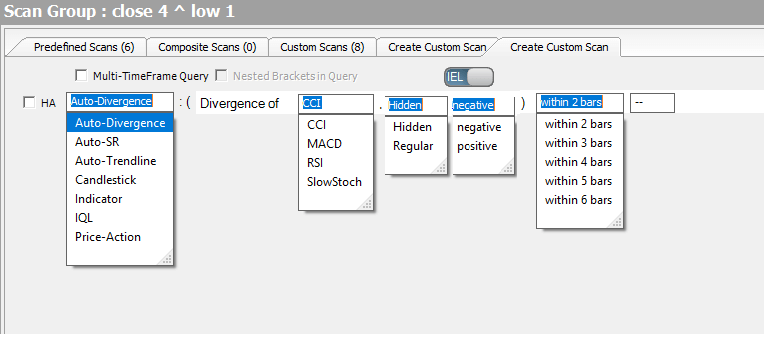
Now, if you want to get Auto Divergence scan you just have to select “Auto-Divergence” from the indicator category in the “Create Custom Scan” window and then you will be able to get your scan based on Auto-Divergence.
Multi-timeframe Custom Scan
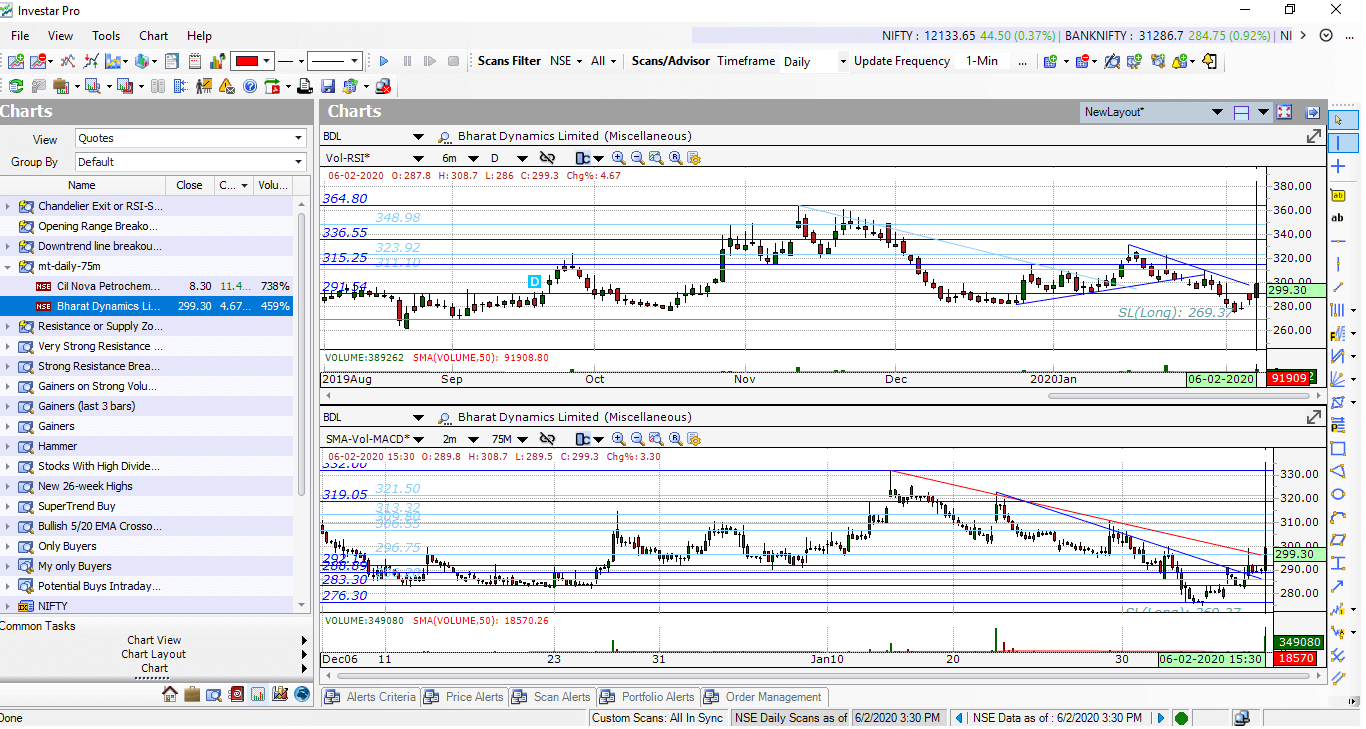
With this release, the Multi-timeframe Custom Scan has now no limitations. You can scan for multiple timeframes with a complex query of AND and OR operations combining different timeframes. Here is an example of a default Daily and 75-min “Multi-timeframe Daily-75min Volume Breakout Scan” which gives good results for short-term volume breakouts (We regularly post the results of this scan on our Twitter, Facebook, Instagram, Youtube and Telegram accounts):
Only Buyers/Sellers
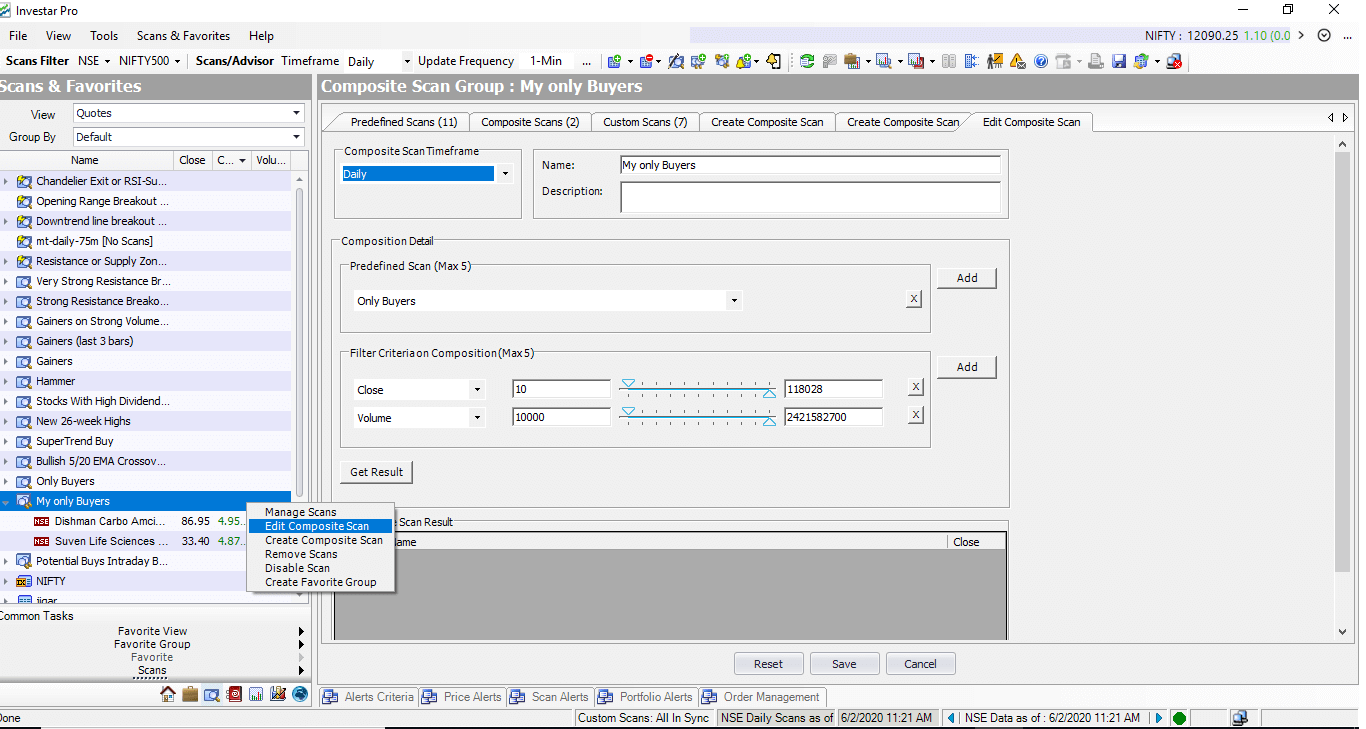
Often times one wants to find potential circuit breakers, and the “Only Buyers/Sellers” are pre-defined scans that can help you in finding them. These scans will scan for stocks where there are either no sellers (“Only Buyers”) or no buyers (“Only Sellers”). They can be also combined with some simple price and average volume criteria to filter out the penny stocks or thinly traded stocks as follows:
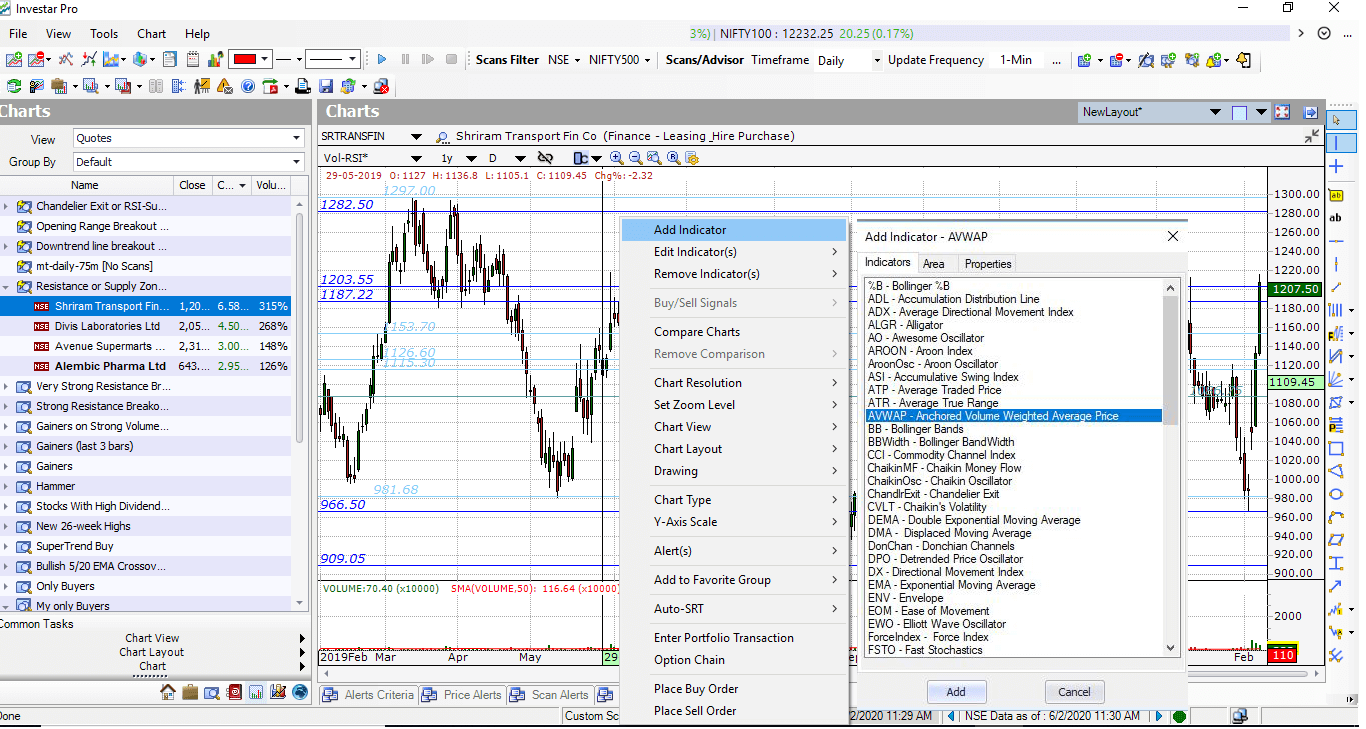
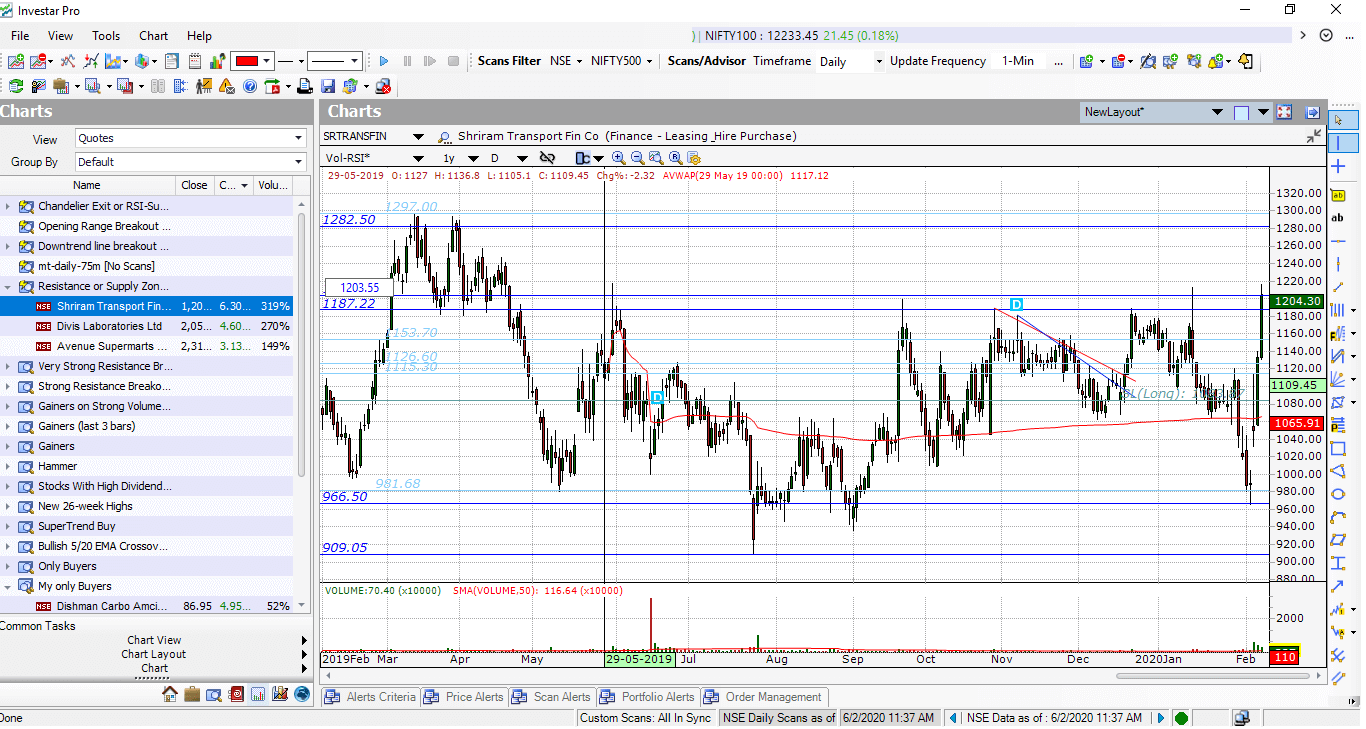
Anchored VWAP
This new indicator allows you to add a VWAP indicator which is anchored to a certain date by simply right clicking on a certain date in the chart and then selecting “Add Indicator-> Anchored VWAP”. It will always start the VWAP calculation from the anchored date, as shown in the example below:
Zerodha XML Contract Notes
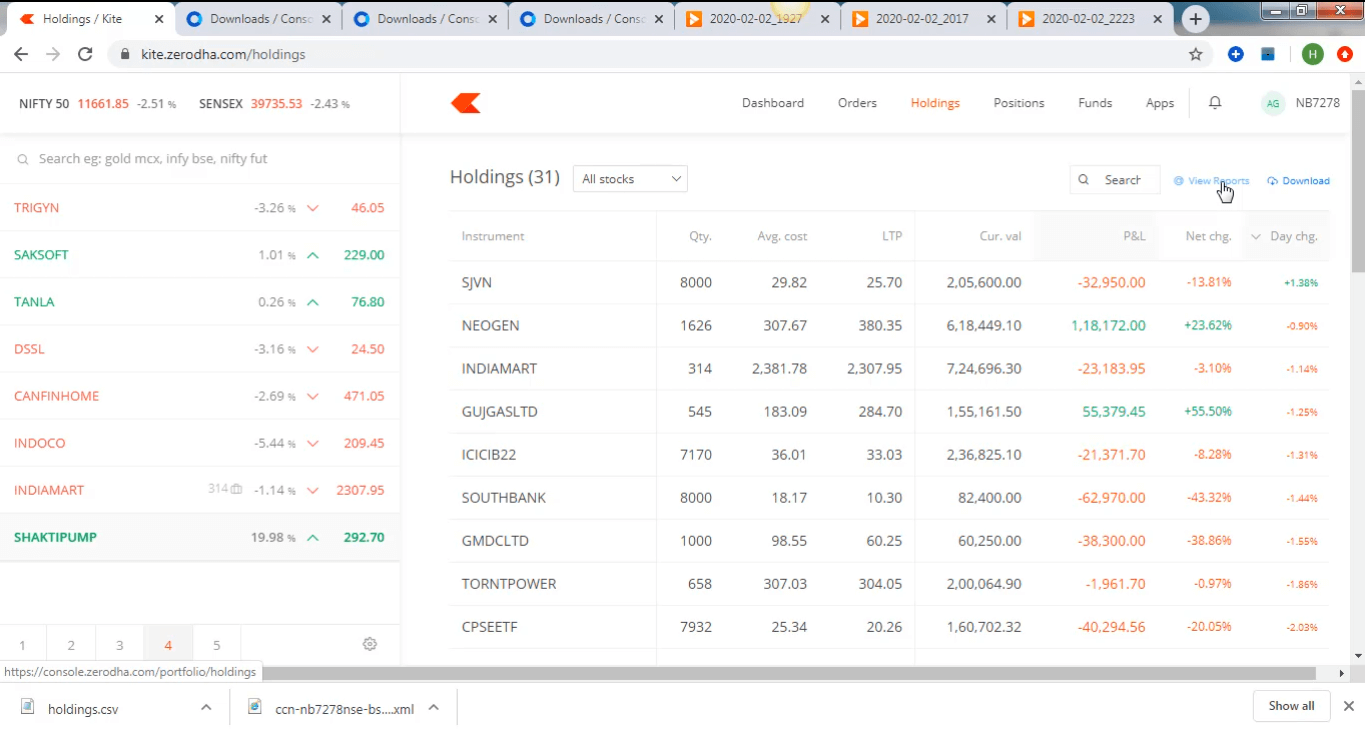
Our users have at times reported that Zerodha PDF contract notes are hard to import and this is because Zerodha has changed their format too many times. Now, we’ve added support for their XML contract notes, which means you will be able to import all your zerodha transactions easily in Investar if you use the Zerodha XML Contract note import feature. Here are the steps involved in it.
Step -1: Open Kite Holdings & Click on View Report
Step -2: Click on Download
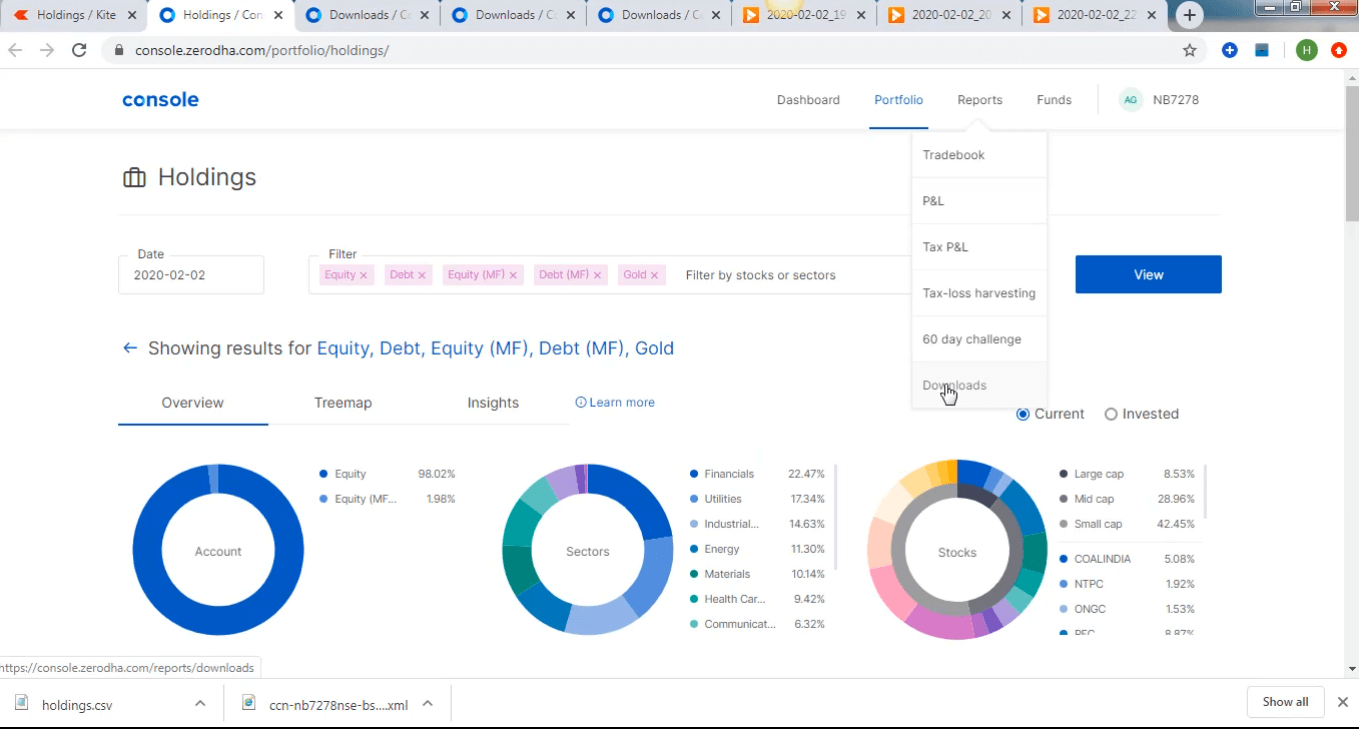
Step -3: Select Date, Report type & Trade type

Step -4: Import XML Note in investar

Step -5: Map the Stocks using zerodha code
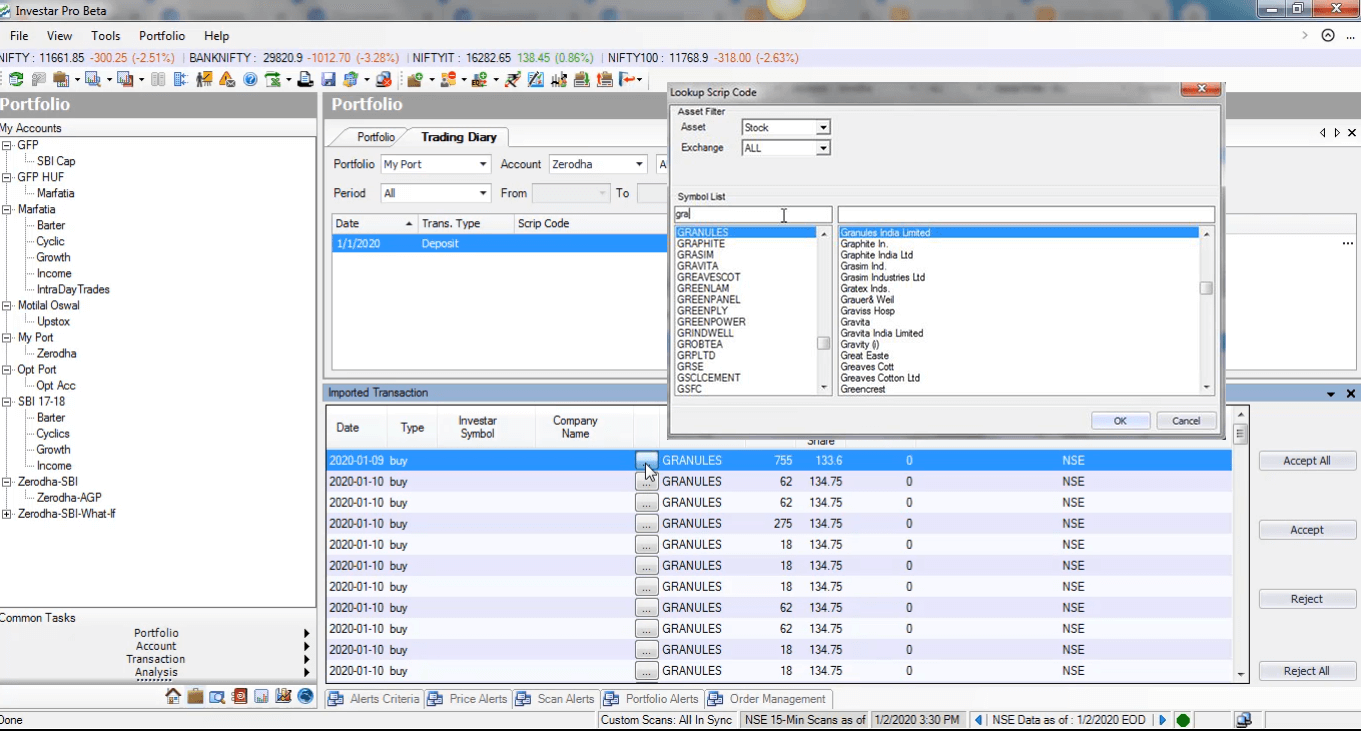
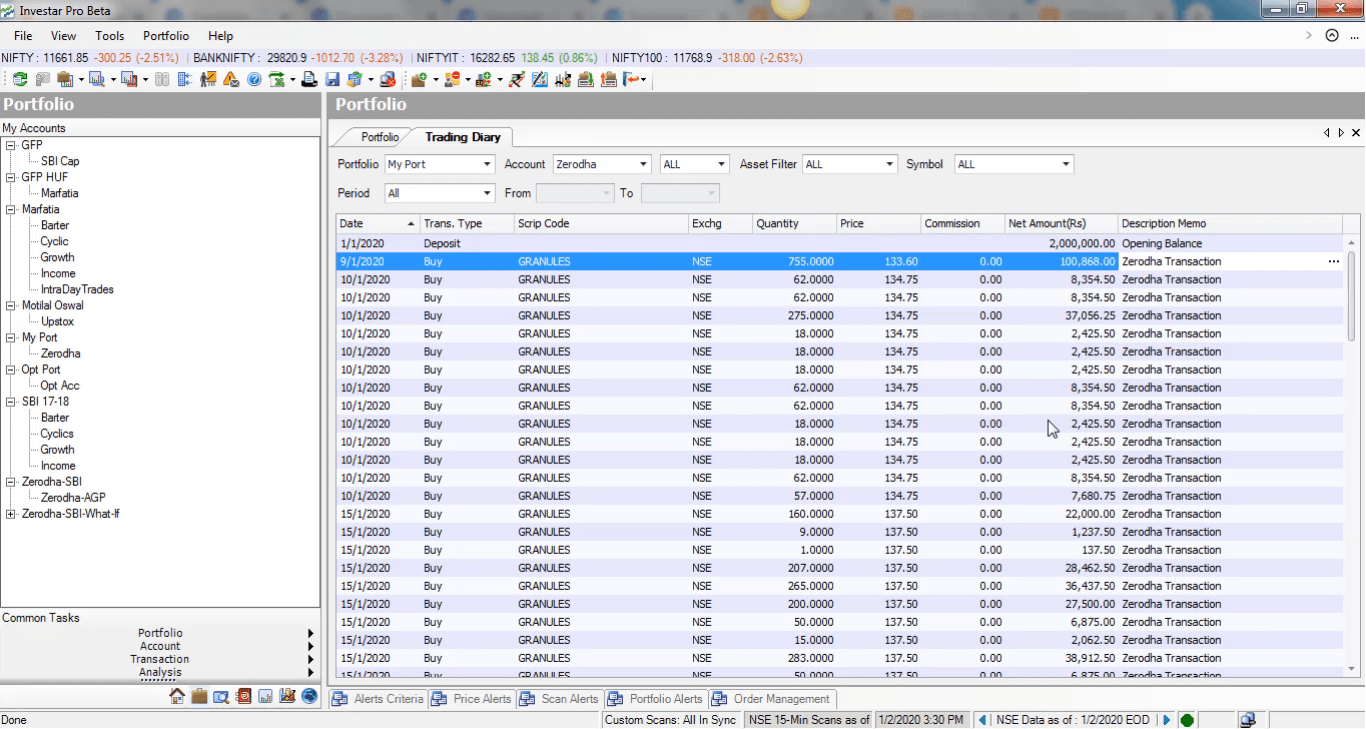
All Transactions Imported Successfully from Zerodha
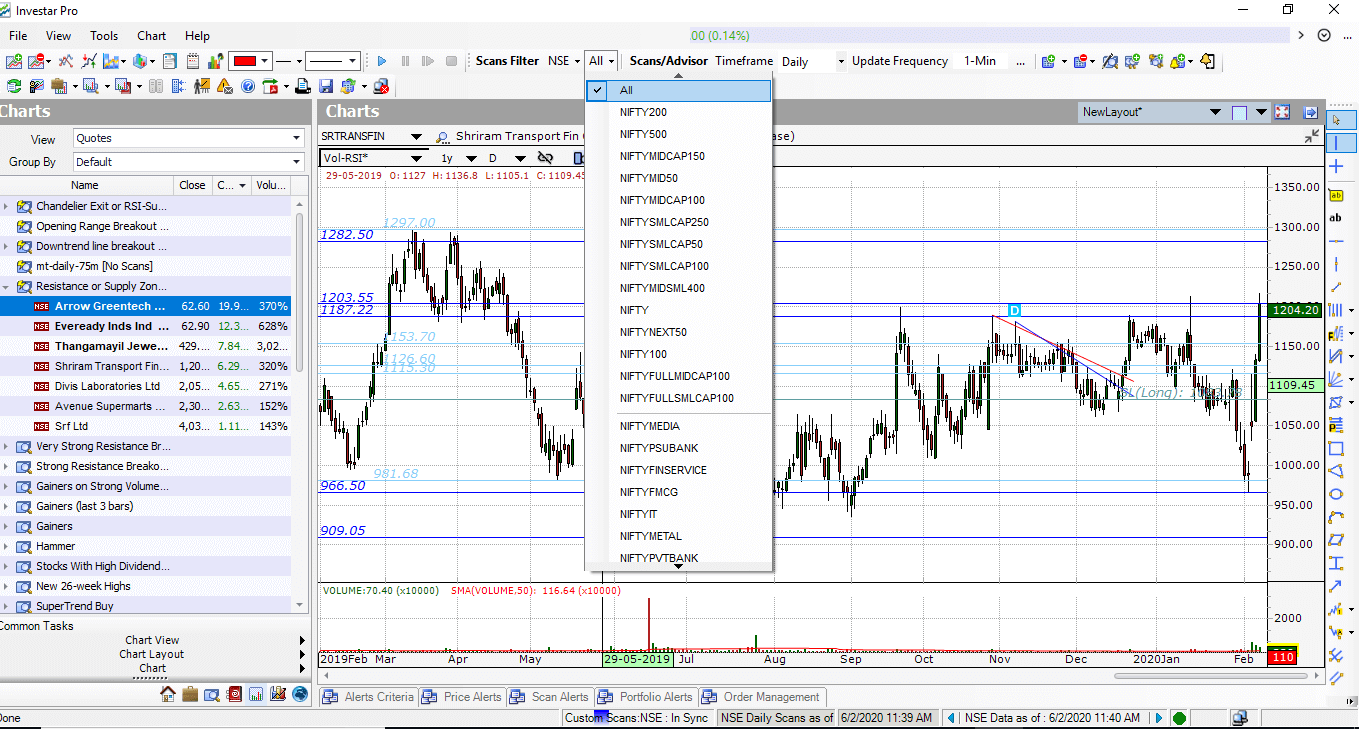
Support for Broad-based, Sectoral and Thematic Indices
Investar 6.1 supports almost all the Broad-based, Sectoral and Thematic Indices which means that you can not only filter the scan results based on them, but also create Favorite Groups out of any Index using “Add Favorite Index Group”.
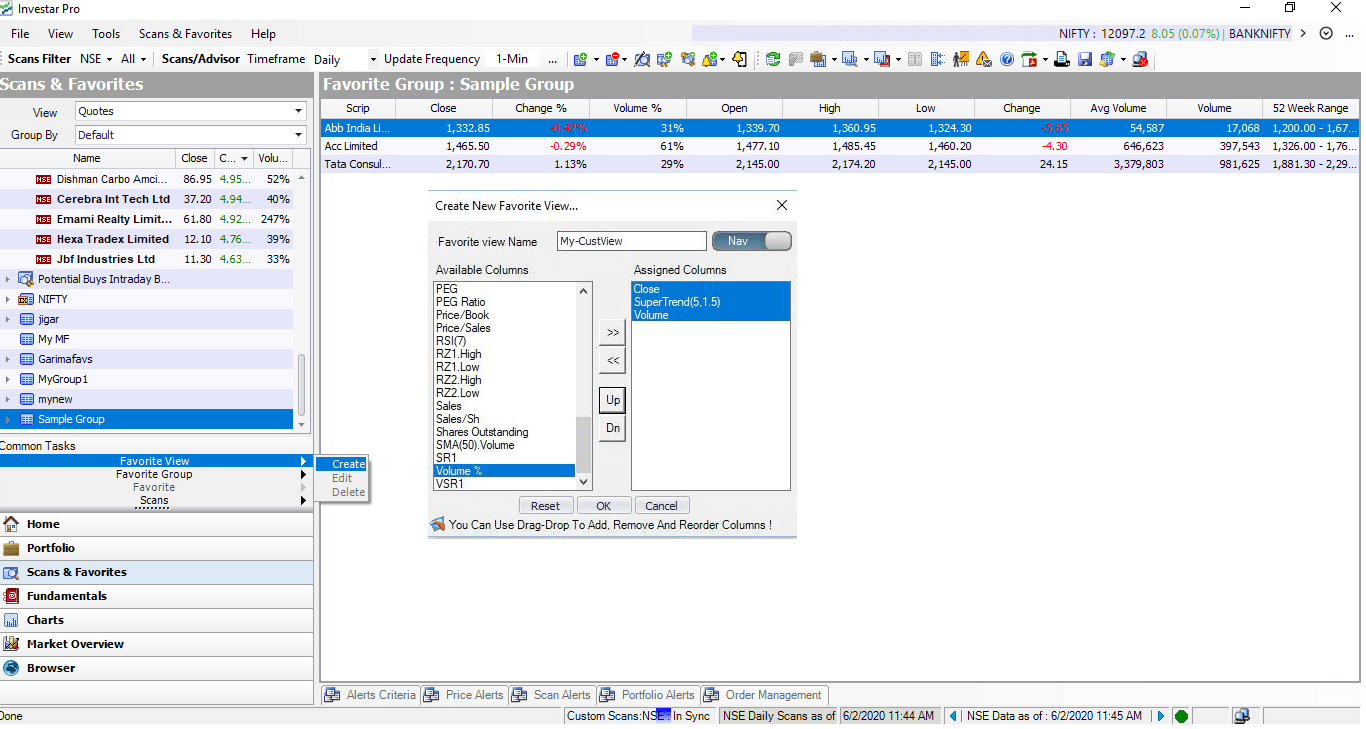
Custom Favorite Views
You can now customize the Favorite View columns with pre-defined values that you want and in the order you want. We now even support addition of Custom Scan parameters as column values as shown in the screenshot below:
If you’d like to see the above features in action, you can see the “What’s New in Investar 6.1” video