Technical drawing tools play an important role in analyzing charts and are an important part of any Technical Analyst’s tool set. Drawing tools help you in your technical analysis, market timing, locating support and resistance levels in recognizing price patterns, confirming trends and much more. With Investar drawing tools, you may draw Trend Lines, Fibonacci Retracement, Fibonacci Fan, Andrew’s Pitchfork, Gann Fans, and other vital studies.
Investar offers a complete set of tools for technical analysis that can be added to the chart. Combine these tools with a range of indicators to perform your own technical analysis. This article is divided into 2 parts for convenience & ease of learning. This is the 1st part here we will see all the basic drawing tools use for Technical Analysis.
To learn how to apply them, we will see the detailed list below:
![]()
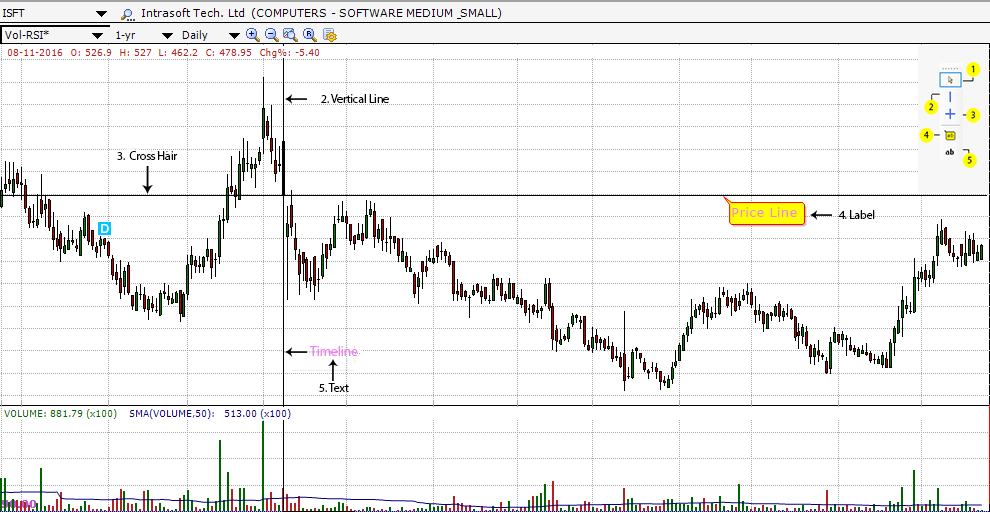
- The first is the Selection Mode.
- The 2nd tool is the Cursor. It is useful in moving to a certain date or time on the chart and seeing more details about the price, indicator values etc.
- The Crosshair tool is similar to a Cursor but uses both a vertical line and horizontal line for moving around on the chart.
- Label tool/Text tool is use to write on the chart. Notes can be easily added with the Label/Text option in the Drawing Toolbar.
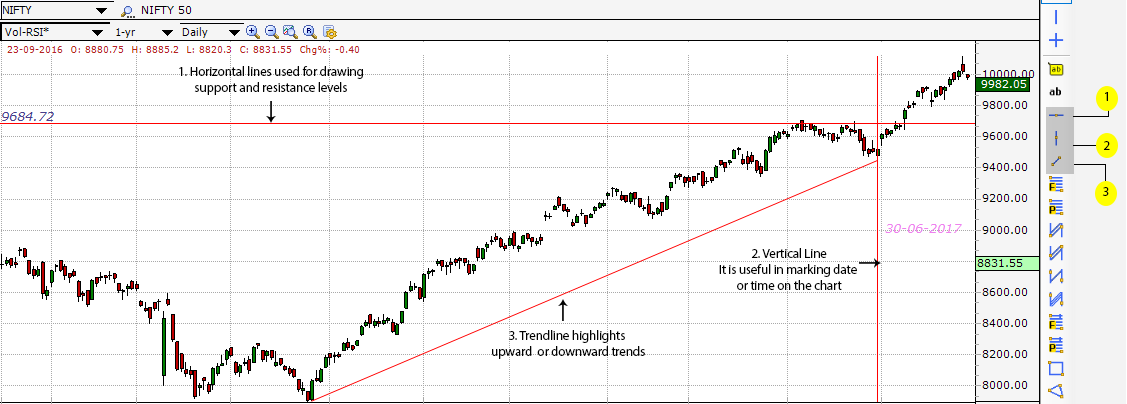
- Horizontal line tool indicates a specific price level and more than one line can be drawn to point support and resistance levels. Horizontal support and resistance line are in general drawn connecting the approximate highs and lows of price bars on a chart.
- Vertical line is useful in marking a particular time level on the chart.
- The Trend Line drawing tool enables you to draw lines to indicate the direction of price movement, to mark indicators’ trending, to define patterns and to link important analytical points on a chart. It is the most commonly used tool by many traders.
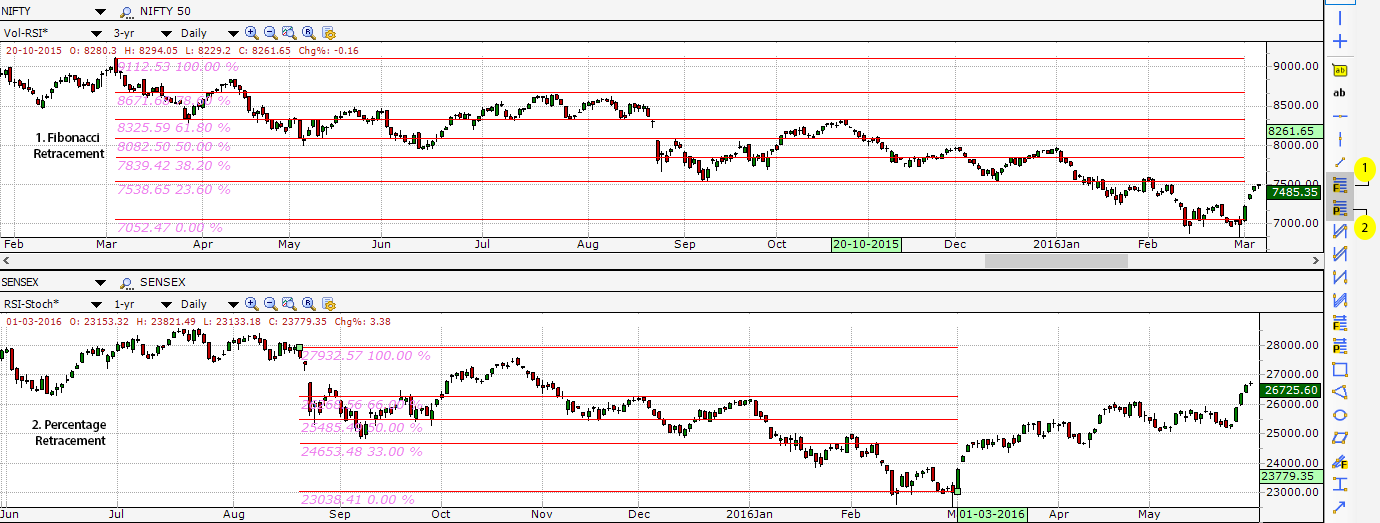
(1) Fibonacci retracements are created by horizontal lines dividing vertical distance between two endpoints of a trendline by Fibonacci ratios of 23.6%, 38.2%, 50%, 61.8% and 100%. The most popular Fibonacci Retracements are 61.8% and 38.2%.
0.0% is considered to be the start of the retracement, while 100.0% is a complete reversal to the original part of the move. Once these levels are identified, horizontal lines are drawn and used to identify possible support and resistance levels. You can read more about Fibonacci Retracements here.
(2) Percentage retracements are a helpful tool for swing traders to determine how far the correction in a trend will move. Prices often retrace up to 33% of the original move. It is not uncommon for prices to retrace up to 50%. Retracements of more than 66% almost always signify an end to the bull market.
Some investors feel that the similarities between 33%, 50%, and 66% and the Fibonacci numbers of 38.2%, 50%, and 61.8% are significant. These investors will use Fibonacci Levels to view retracement levels.
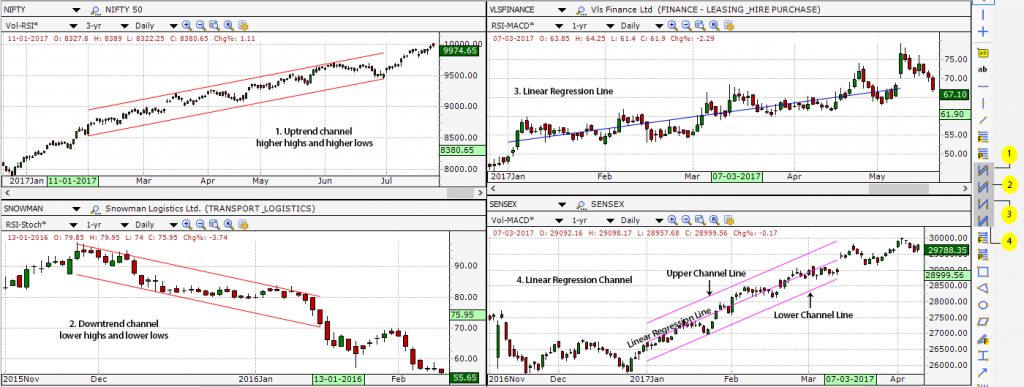
- An uptrend is defined as a series of higher highs and higher lows. The upper horizontal line is the resistance line. The lower horizontal line is the support line. This is also known as Ascending Channel.
- A downtrend is a series of lower highs and lower lows. A downtrend channel is bearish and is a falling pattern. This is also known as Descending Channel.
- A useful technical analysis charting indicator is Linear Regression Line, which is a straight line that best fits the prices between a starting price point and an ending price point. The Linear Regression Line allows you to clearly see whether prices are trending upward, downward or sideways.
- Linear Regression Channel is the analytical drawing tool that draws upper and lower bands above and below the regression line at equal distances from the regression line by placing a price trend between the bands. By drawing two parallel lines over and under the Linear Regression line, we obtain a Linear Regression Channel.
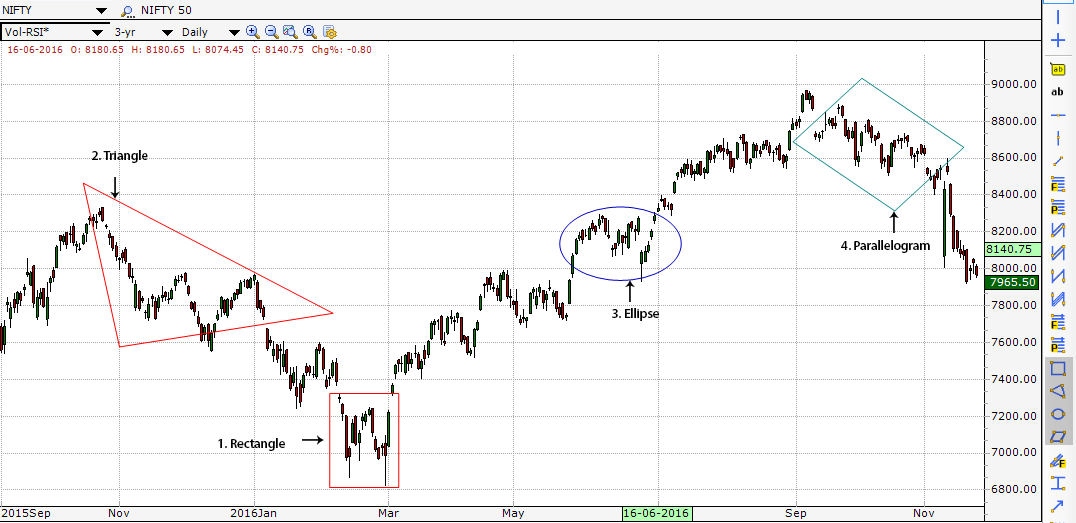
In the Drawing Toolbar, there are some non-analytical tools that are dedicated to highlighting parts of charts.
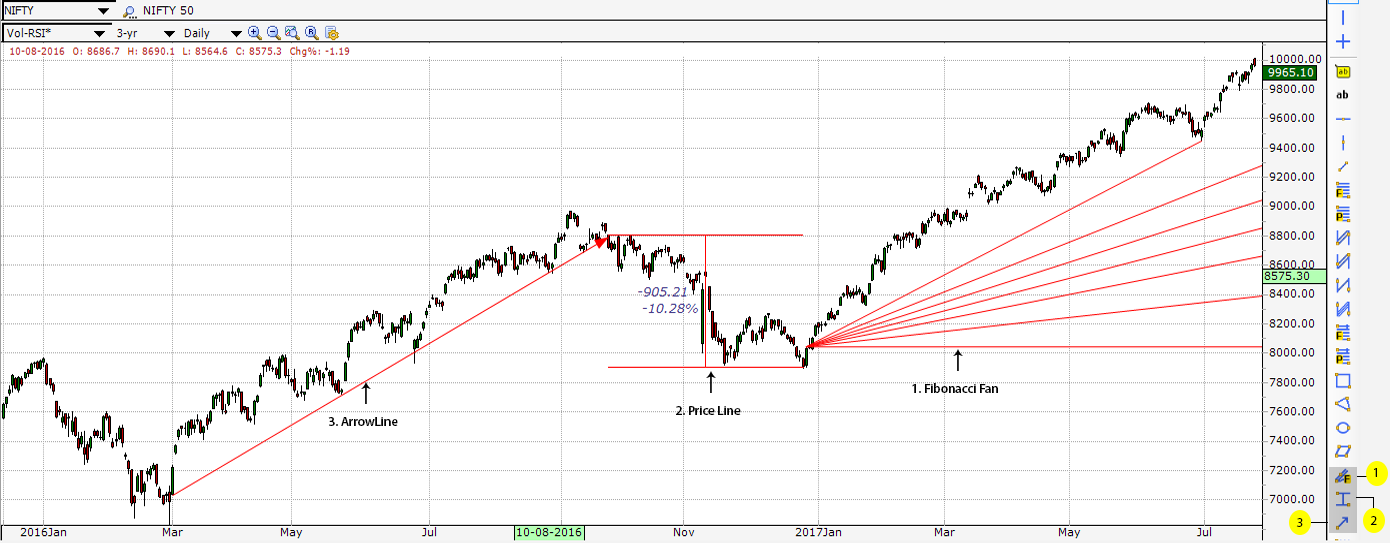
- Fibonacci Fans are angled trendlines constructed using Fibonacci retracement points. After identifying retracement points, these lines can then be used to determine support-resistance or potential reversal zones. The Fibonacci Fan is used to predict short-term price movements, by assuming that price tends to move in the short term between 38.2% and 61.8% of Fan’s line by occasionally bouncing from the 50% line.
- The Price Line draws a pair of parallel lines that outline the channel in which the price moves. The upper line is known as the resistance line and the lower line is called the support line. Visually it’s a way for traders to see where current price (with % value) is in relationship to where price has been previously.
- With the Arrow Line one can estimate the strength as well as possible trend reversal points. It is a non-analytical charting tool.
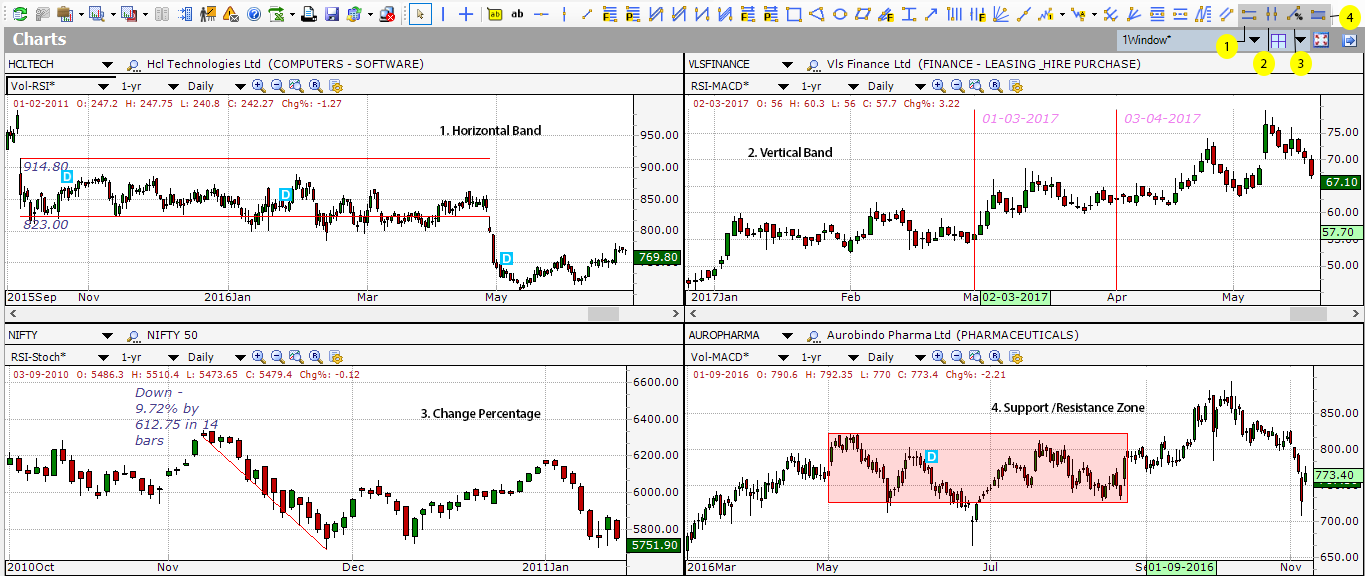
- Horizontal Band is a pair of horizontal parallel lines that outline the equidistant channel in which the market trades.
- The Change% tool allows you to not only see the Change and Change% but also how many bars it took for that change to happen.
- Vertical Band is a pair of vertical parallel lines useful in marking a particular time level on the chart.
- Support/Resistance zones or Supply/Demand zones are formed by clubbing together nearby support/resistance lines. These levels are formed where price has a tendency to halt or reverse and can be used to help identify high probability trade entry and exit points.