With the Modi Government coming back with a majority, what should be your strategy going forward? Here’s a quick blog post to find out sectors followed by a video which you can see to practically see this strategy.
Right after the exit polls were announced on May 19th, the market really rallied a lot and the Nifty had a gap up opening the next day. Once the election results were announced, and it became clear that Modi Government was coming back with an even higher majority, the market rallied a lot initially made a new all-time high and then settled down lower. As we can see in the screenshot below, if we consider the gain afte the exit polls, the Nifty has gained 3.59% while the leading sectors Nifty Infra, Nifty Realty and Banknifty indices have gained as follows:
- Bank Nifty – 5.76%
- Nifty Infra – 8.78%
- Nifty Realty – 9.58%
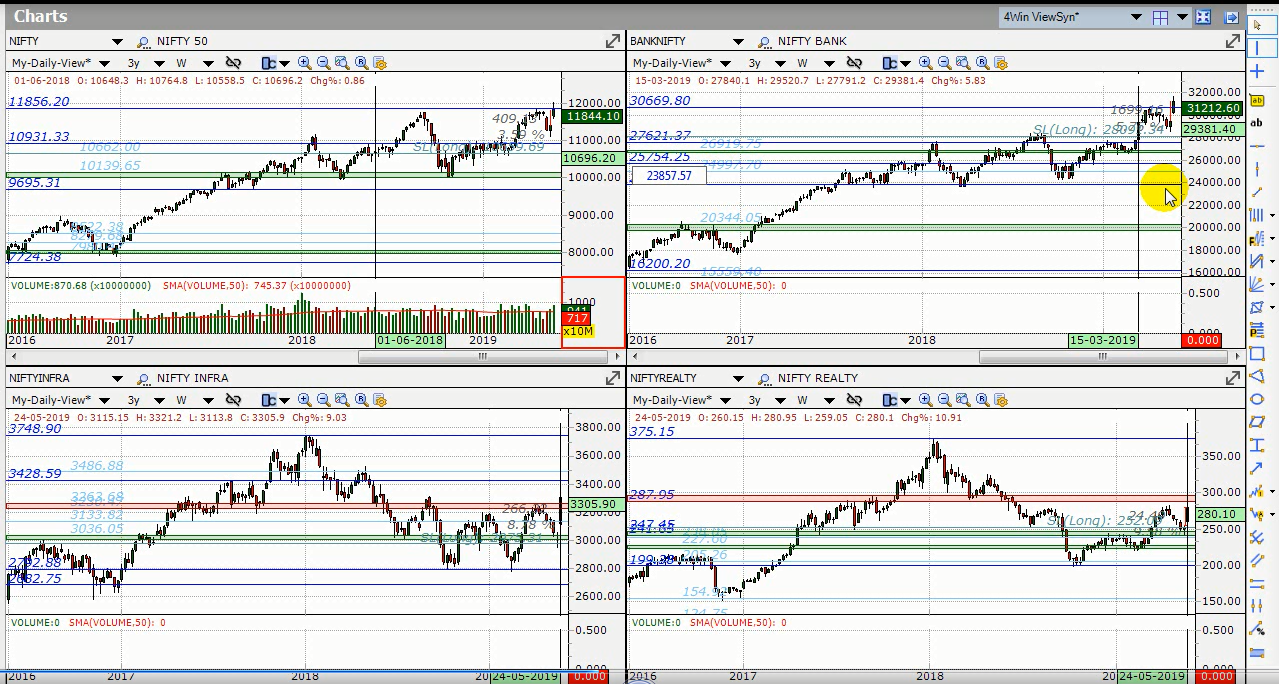
Although the Nifty may go sideways for a while until it actually clearly breaks out, the movement in the 3 indices above gives us a clue as to the stocks that will be leading the rally once the overall market breaks out of the high and starts rallying further. Hence we can look for stocks in these 3 indices for volume breakouts and maybe even potential multibaggers.
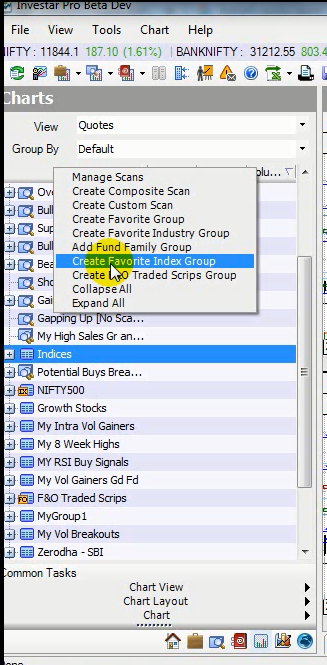
Let’s add the Bank Nifty by right clicking “Add Favorite Index Group” and then selecting the appropriate index.
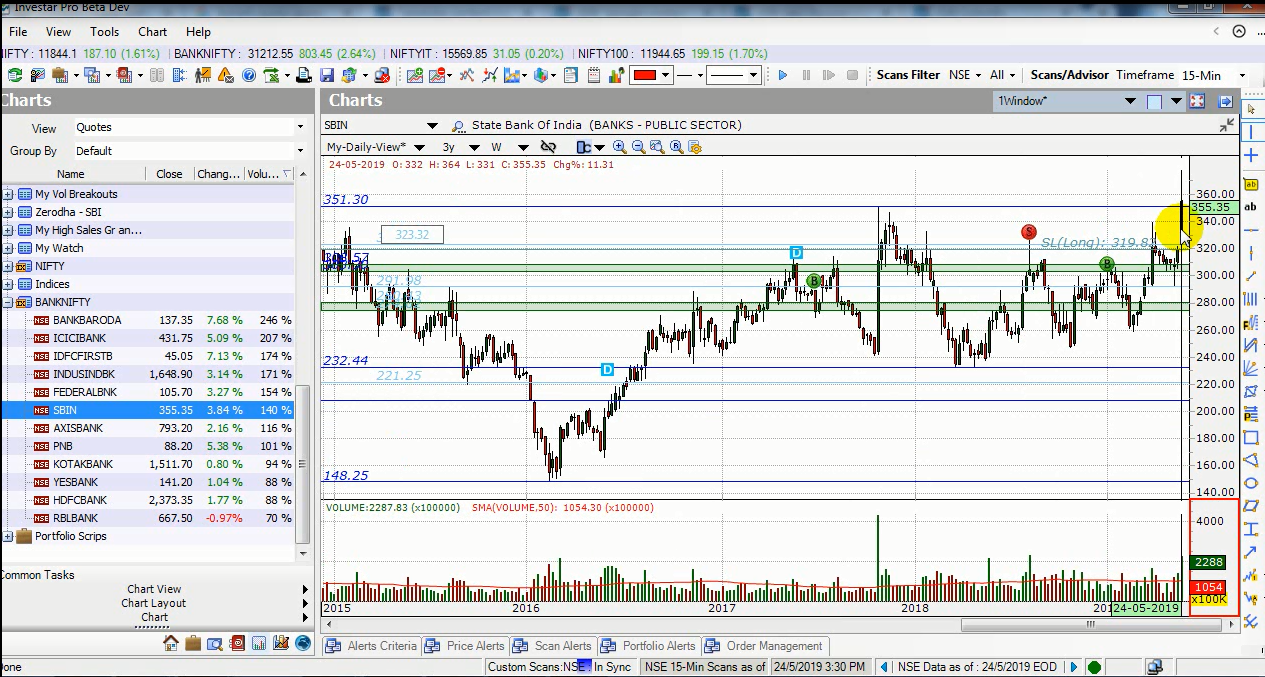
The Bank Nifty is rallying because of the potential after the effect of the PSU bank restructuring, and this is already seen in stocks like SBIN as in the below chart, which is making a new high.
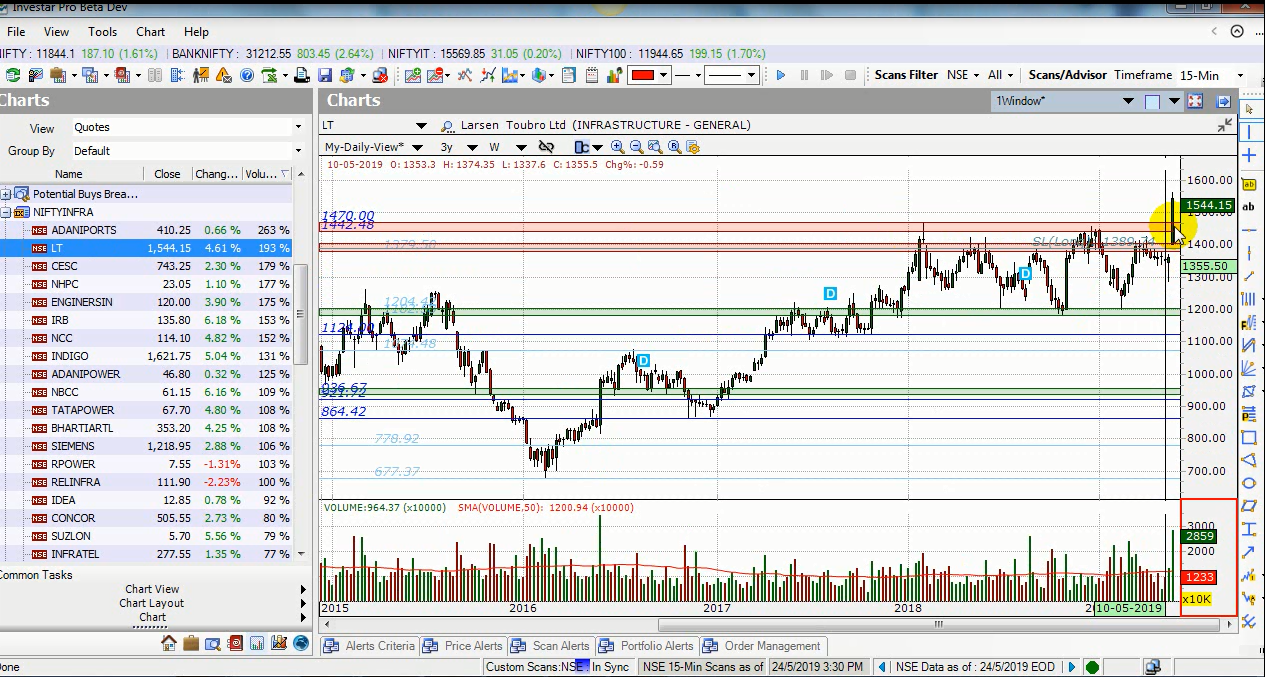
As expected, in the Infrastructure sector, stocks like L&T are making a new high, and this probably because the Modi government is known to spend a lot in infrastructure:
Although very few stocks maybe making a new 52-week high or all-time highs, it is the right time for looking at volume breakout scans in Investar and apply the strategy mentioned in How to identify Good Volume Breakouts blog post and Finding High-Volume Breakouts blog post.
A specific way to use this strategy for identifying stocks for long-term potential multibaggers has been described in the How to identify Multibaggers for investment post.
And if you are using the Custom Screener, you can also create some more specific volume breakout scans using Auto-Support/Resistance and Auto-Trendline and Auto-SR Zones to identify such volume breakouts.