What is a Moving Average?
Moving averages are trending indicators and are widely used because of their simplicity and effectiveness.They do not foresee price direction, yet rather define the current direction, though they lag due to being based on past prices.
Every type of moving average (commonly written as MA) is a mathematical outcome that is determined by averaging a number of past data points.A moving average helps smooth out price action by filtering out the “noise” from random short-term price fluctuations.
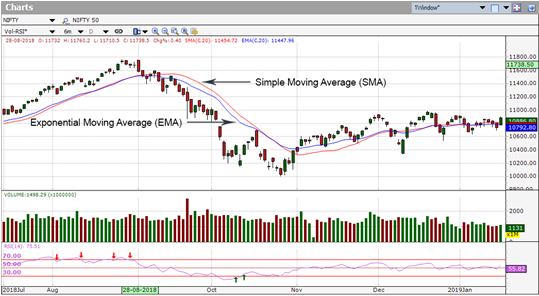
The two basic and generally used moving averages are the simple moving average (SMA), which is the simple average of a security over a defined number of time periods, and the exponential moving average (EMA), which gives more prominence to more recent prices.
Here’s a chart with both an SMA and an EMA on it:
What is Simple Moving Average – SMA?
A Simple Moving Average (SMA), as the name proposes, is a moving average of the Closing Prices. SMA is the easiest and effortless moving average to use. It is just the normal average price over the specified period. The average is called “moving” because it is plotted on the chart bar by bar, shaping a line that moves along the chart as the average value changes.
How Simple Moving Average works
SMAs are usually used to identify trend direction. If the SMA is moving up, the trend is up. If the SMA is moving down, the trend is down. A 200 day moving average(SMA) is typical proxy for the long-term trend. 50-bar SMAs tend to be used to evaluate the intermediate trend. Smaller time period SMAs are useful to identify shorter term trends.
Buy/Sell Signals are generated in SMA when:
- Price crosses moving average
- Two moving averages cross each other.
E.g.(see the chart below) :
- 5-Day SMA crossing over 20-Day SMA generates a Buy Signal
- 5-Day SMA crossing below 20-Day SMA generates a Sell Signal

Above is a daily chart of Nifty. Throughout the uptrend, the 5-day SMA is above the 20 –day SMA. Hence it generates BUY signal when 5-day SMA crosses above 20-day SMA.
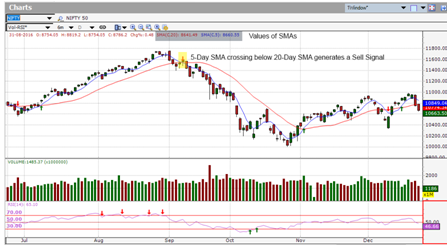
When 5-Day SMA is below 20-Day SMA, itis a downtrend and hence 5-day SMA crossing below 20-day SMA generates a Sell Signal.
Advantage of the SMA
- The SMA is considered the simplest calculation, as the average price over a chosen time period.
- With the use of SMAs, we are able to identify whether or not a pair is trending up, trending down, or simply ranging.
What is Exponential Moving Average – EMA?
Exponential Moving Average (EMA) is similar to Simple Moving Average (SMA), evaluating trend direction over a period of time. However, on the one hand where SMA merely computes an average of price data, EMA gives more weight to data that is more current.
How Exponential Moving Average works
The similar rules are applied to SMA while interpreting EMA. Take into account that EMA is usually more sensitive to price movement. Generally, Exponential moving averages (EMA) give more weight to the most recent periods of time.
While the EMA rises, you might want to consider buying when prices dip close to or just below the EMA. The minute the EMA falls, you might consider selling when prices rally towards or just above the EMA.
Here is a chart of Nifty. A 50-day SMA ( blue ) and a 50-day EMA ( red ) on nifty’s closing prices . Though both SMA and EMA are for a 50 day period, you can notice that the EMA is more reactive to the prices and hence it sticks closer to the price.
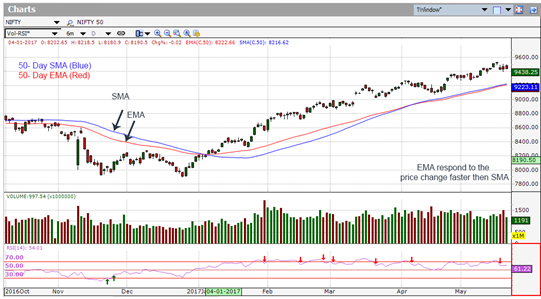
The EMA gives a higher weighting to recent prices, while the SMA doles out equivalent weighting to all values. This encourages the trader to take quicker trading decisions. Subsequently, hence, for this reason, traders prefer the use of the EMA over the SMA.
Advantage of the EMA
- EMA gives a higher weighting to recent price changes, it reacts more rapidly to value changes than the SMA does.
- EMA could itself be used as an indicator.
- For investors who deal intraday and fast-moving markets, the EMA is definitely more appropriate.
The Difference between the EMA and SMA
The real distinction between an exponential moving average and a simple moving average is an affectability each one demonstrates to changes in the data utilized in its calculation.
All the more explicitly, the EMA gives a higher weighting to recent prices, while the SMA assigns equal weighting to all values.
Moving Average Calculation Method
Whether you are using the 50-day, 100-day or 200-day moving average, the method of calculation and the manner in which the moving average is interpreted remain the same.
A moving average is simply an arithmetic mean of a certain number of data points. The only difference between a 50-day moving average and a 200-day moving average is the number of time periods used in the calculation. The 50-day moving average is calculated by summing up the past 50 data points and then dividing the result by 50, while the 200-day moving average is calculated by summing the past 200 days and dividing the result by 200.
200 day moving average Example
The 200-day simple moving average (SMA) is considered a key indicator by traders and market analysts for determining the overall long-term market trend. The price level in a market that coincides with the 200-day SMA is recognized as a major support level when price is above the 200-day SMA or resistance level when price is below the 200-day SMA level.
You can calculate the 200-day moving average by taking the average of a security’s closing price over the last 200 days [(Day 1 + Day 2 + Day 3 + … + Day 199 + Day 200)/200].
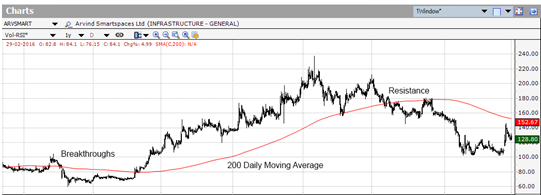
200-day moving average Example
The red line represents the 200DMA for the close price. Here you can see how 200-day moving average acts as a Resistance from where we see a reversal.
Which Moving Average is More Effective?
Moving averages smooth out past price data as a result investors can more accurately observe the latest trend. They filter out the noise thereby making it much simpler to notice exactly what direction a market is heading.
The features of an EMA and SMA are in most cases equivalent, traders’ use EMAs and WMAs over SMAs if they are concerned that the consequences of lags in data might minimize the responsiveness of the moving average indicator.
All moving averages have a substantial downside in that they are lagging indicators. Since moving averages are based on past data, they undergo a time lag before they indicate a change in trend. A stock price may move quickly before a moving average can exhibit a trend change. A shorter moving average suffers from less lag than a longer moving average.
Having said that, Moving Averages continue to be the most popular technical analysis indicator out on the market today.