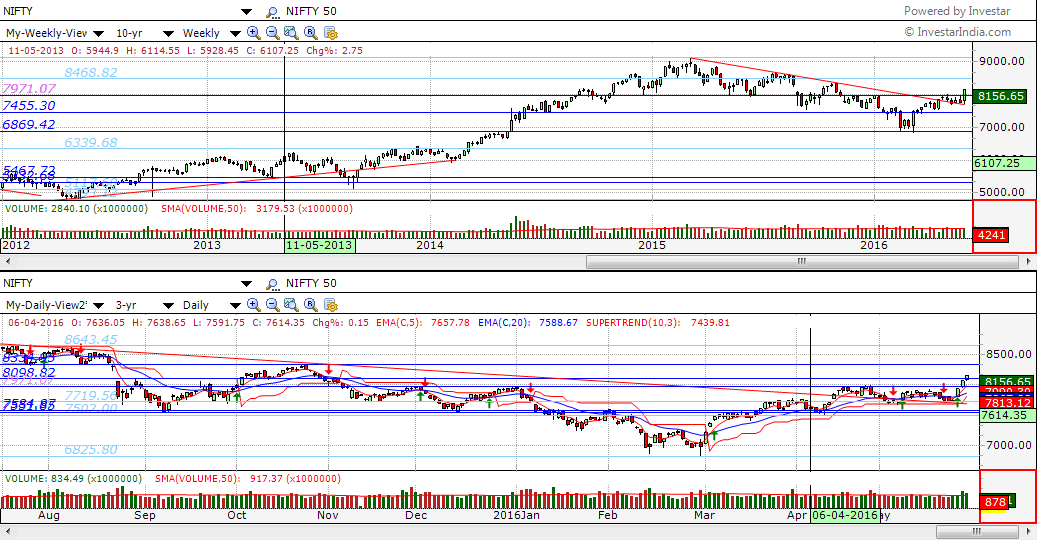
Last Thursday, the Nifty broke out of the 7971 level decisively on a Daily and Weekly chart (as shown by Auto-Support/Resistance blue lines in the chart below). The rise in volume on the breakout is clearly visible on a Daily chart, and is clearly a good sign that the rally is backed up by strong volume, and hence has a good chance of success.
The Nifty had broken the long-term downtrend line (that started on 5th Mar, 2015) on a weekly chart on 22nd Apr, 2016 on low volume but after that it was consolidating. It started rallying on 25th May and went up 3 days in a row to close at 8156.
We want to highlight how useful the Auto-Support/Resistance tool is to find out key support resistance levels. If you haven’t used it yet, here’s a short video to get you started. Most software out there provide either the Pivot Levels and masquerade them as automatic support/resistance or just take the highs and lows as support and resistance. The Investar Auto-SR levels use Artificial Intelligence (AI) to figure out all possible support/resistance levels (taking into fact that an SR line can be a support at some time and a resistance at other times) and then rates them based on:
- Number of touches
- Recency
- Length
- Support/resistance violations
The first three points contribute to the strength of the SR levels and increase the rating, and the last one penalizes the SR level and lowers the rating. The lines in the top 20%ile are marked as “Very Strong Resistance/Support” dark blue lines. The lines in the next 20%ile are marked as “Strong Resistance/Support” light blue lines.
So, how does the current rally compare to the one that was started in March 2014 before the NDA government came to power (For details, see the Facebook post we did at that time; of course, we didn’t have Auto-SR so the lines are all hand-drawn!). Although, the 7971 is a dark blue “Very Strong Resistance” Auto-SR line, while the 6337 is light blue “Strong Resistance” line, this should not be taken as the current rally being stronger than the previous one in Mar 2014. This is because Auto-SR lines are dynamically calculated as time changes and in fact as recently as Feb 2016, the 6337 level was considered to be a “very strong” level as per Investar Auto-SR.
The March 2014 rally was stronger in various ways:
- It was a breakout from a very long sideways trend.
- It was also a new high.
In any case however, it is a good time to start looking for interesting stocks to find based on the volume breakout strategy.
Nice information. Thanks for sharing.