Generally speaking, breakout trading is used by active traders to take a position within a trend’s early stages. We all know that no trendline will last forever. So this article focuses on how to trade trendlines when they break.
Let’s get started and first understand why Trend is important.
It is important to identify and understand trends so that you can trade with rather than against them. Always remember “Trend is your Friend”. Trading in the direction of the Trend maximizes your chance of success.
Traders can identify the trend using various forms of Technical Analysis, including both trendlines and technical indicators. However, using a trendline is the strongest form of confirming that a trend exists.
Trendline Trading Strategy
Trendlines are plotted along the uptrends and downtrends for the trader to quickly visualize the strength and slope of a given trend on a given timeframe, so a trader can enter in with the trend at retracement points or at breaks of the trend at trend reversals. When a trendline breaks, it usually means the trend is changing, unless of course, it’s a false break-out.
How to Plot a Trendline?
Simply Right-click on the Chart in Investar software and click Enable Auto Trend Line as shown below.

And you can see the trendlines on your selected chart. You can also set the Auto Trend Line option to the current cursor so that you can get a clear picture of the trend that stock had on that particular day.
As you can see in the chart below, we were in a downtrend in Dilip Buildcon Ltd from Mid Nov 2018 to Jan 2019.

As you can see in the above chart, there was a breakout on 12th Feb, the stock rallied on increasing volume and this was the sign of big money flowing into the stock.
Note: The main part of the strategy is that when there is a downtrend breakout, you need to make sure that there is above average volume on the day of the breakout as well as a couple of bars preceding it.
So to understand this price volume pattern that we have seen in the above chart, let’s understand how the Price & Volume Patterns works:
Price & Volume Trends can be together used to confirm the strength of price movement.
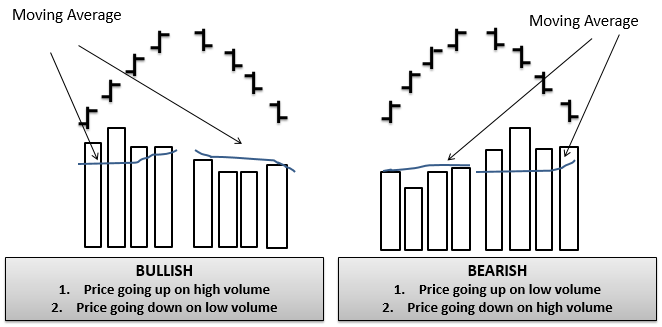
- Increasing price along with increasing volume, confirms the uptrend and is a healthy sign of a strong uptrend and hence is Bullish.
- Decreasing price along with decreasing volume is Bullish because it indicates weak retail investors are selling and hence is not a reason to worry. This is probably a good thing because once the consolidation happens, the breakouts will be much stronger.
- Decreasing price along with increasing volume indicates that the big guys are selling and hence is Bearish.
- Increasing price along with decreasing volume indicates weak retail investors are buying and is a cautionary sign and should make you doubt the upward price movement (i.e. it is Bearish).
So let’s come back to the chart of Dilip Buildcon Ltd and we can clearly see that the stock is indeed exhibiting the first price volume bullish pattern, which is the rising price on above-average volume. The second thing we can notice that once the stock has gone down it actually corrected, but the correction actually happened on below-average volume so that is the 2nd price volume pattern which is again bullish as we said earlier.
Now let’s try to put Auto Support/Resistance levels also on the same stock chart and for that just right click on the chart and Enable Auto S/R.
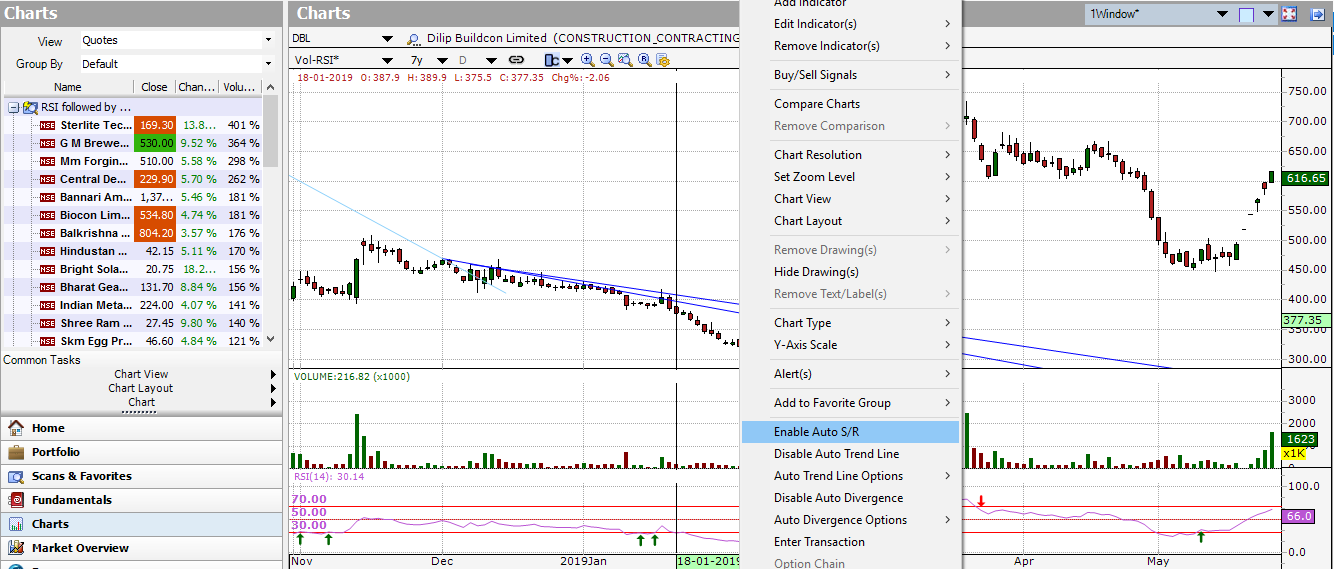
Note: Make sure you have selected the Auto S/R option of Enable S/R zones and Auto S/R based on Current Cursor are checked.
Now we can see that once the stock broke the resistance zone, later on, it corrected and actually got support at this particular point since the resistance zone once broken turns into a support zone.
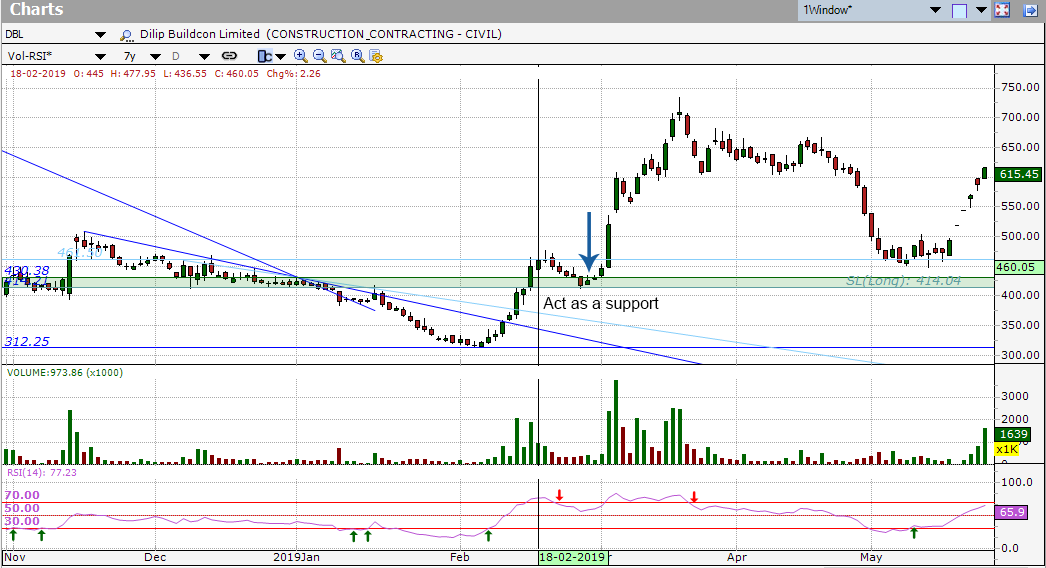
So one thing we notice about this strategy is that the entry point using a downtrend line came a lot earlier than the volume breakout that happened much later in the rally and hence this particular strategy can help you identify stocks which actually are much earlier in the rally compared to at times that you can get with a resistance breakout strategy as described in this blog post . Although this is not true in all cases, in many cases it can be true.
Check out our video on “Trendline Trading Strategy based on volume breakout” for an in-depth look into this topic.
Hi,
You are absolutely write , Trade is our friend but if you know the trick . nice explanation of Bullish and Bearish movement.
Very informative article about Trendline trading … can you share any article about Crypto coin …