From the beginning we wanted Investar to be a one-stop solution for all traders and investors. Considering this, we’ve built a very sophisticated Portfolio Manager into Investar (with features like “As Of” which allows you to see your position on any date), but the most important feature (and maybe the most under-used one) is the one where any transaction that you enter into an account (in a portfolio) will be shown in the chart.
A user’s Portfolio in Investar consists of upto 5 Accounts, each of which is mapped to a broker account. A Buy or Sell transaction can be entered into an Account by manually entering it or by Importing Multiple Contract Notes using Investar. Very soon we will be having a facility to trade directly through a leading discount brokerage.
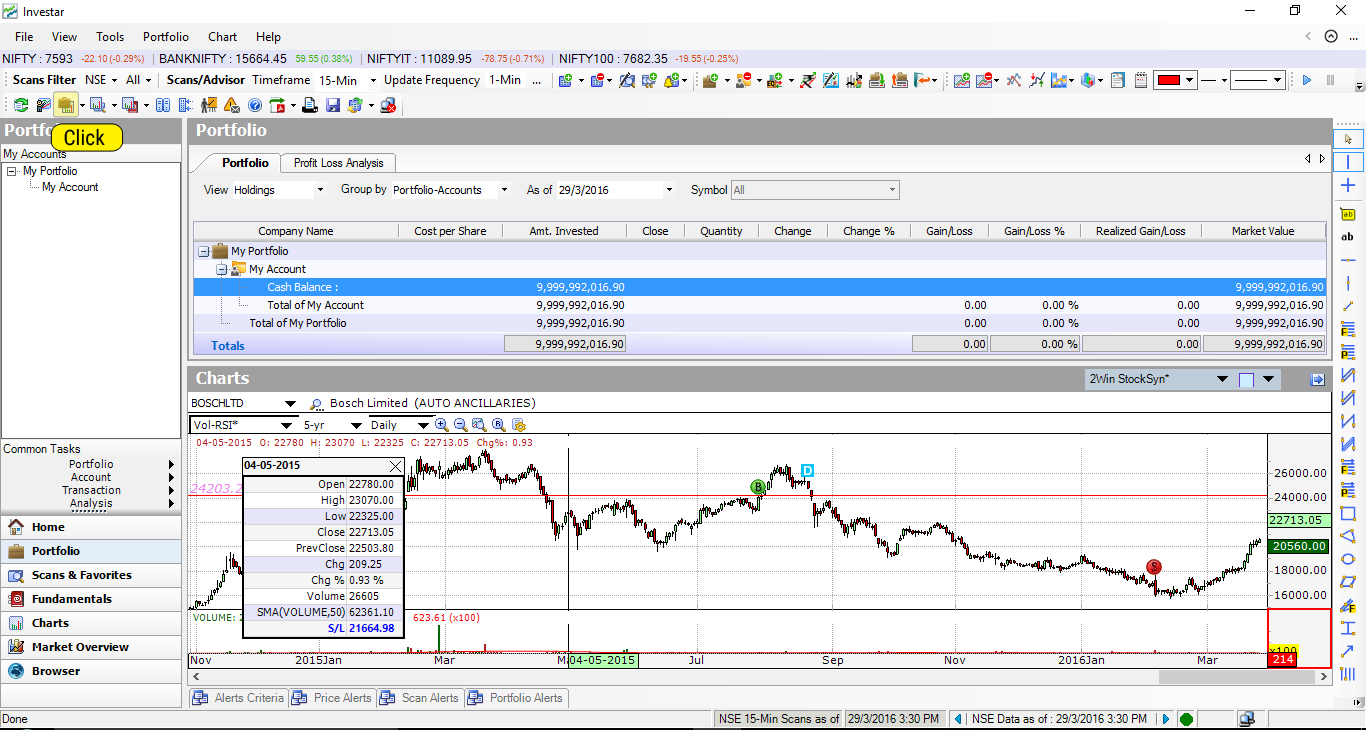
Once you have imported all transactions, however, you can use the Portfolio Manager with Charts by clicking on the “Portfolio with Charts” button. This helps you to visualize how your trades are doing and to improve your performance as a trader. In the screenshot below, it is clearly visible that the breakout Buy on 29th July, 2015 did not work out and shows the perils of not taking a proper stop-loss (as described in Importance of setting Stop Losses). Instead the trader actually closed out the position on 5th Feb, 2016 when there was panic selling in the stock resulting in a loss of 33.16%.
Talk to any professional trader, and the way to improve yourself as a trader is to minimize your mistakes but if you do not have a tool to clearly visualize your mistakes (or successes), how can you expect to succeed in the market. So if you’ve been delaying the use of this feature, start using the “Portfolio with Charts” feature in Investar to improve your effectiveness!