A Renko chart is a form of a chart, developed by the Japanese. The term “renko” is derived from the Japanese term “renga” meaning “bricks”. Renko is based on movements in price instead of time.
A Renko chart is designed by placing a brick in the next column as soon as the price surpasses the top or bottom of the previous brick by a predefined amount. These bricks are sometimes often called “blocks” or “boxes.” A box on the renko chart forms once the price has moved that amount, but not before. A candlestick chart, on the other hand, shows the price movement over a period of time, with each candle representing an interval for instance 1 minute/5 minute or 1 day.
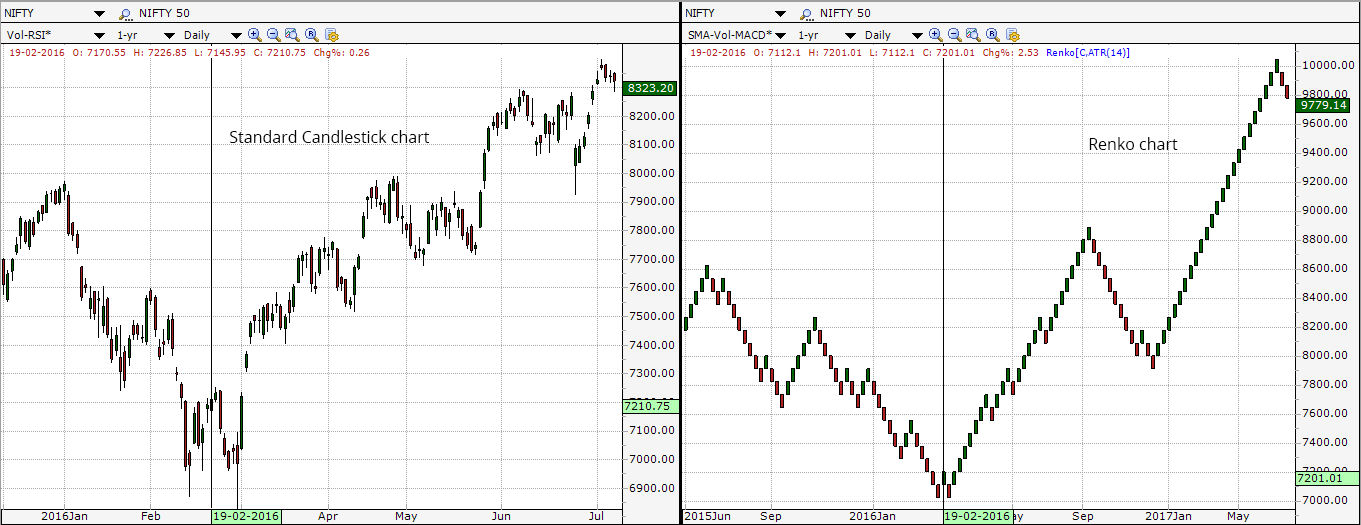
The most remarkable difference is just how smooth the Renko chart looks compared to the candlestick chart.
A new Renko box always forms at the top or bottom right corner of the last Renko box, meaning the price action is always portrayed at 45-degree angles.”Up” boxes are typically colored white or green. A “down” box is typically colored red or black.
One major difference with Renko charts is that they don’t give you the most current information. The chart only updates when a new box is formed. The candlestick and Renko chart snapshots were taken at almost the exact same time, yet the candlestick shows a price of 7210.75 while the Renko chart shows a price of 7201.01 Candlestick charts always show the last price or trade (considering you have real-time quotes), while Renko charts show the price that created the last box.
Setting the Renko Chart Type in Investar
To set the Chart Type:
Step 1: View Stock Chart / Future/Option Chart whose Chart Type is to be changed.
Step 2: Select a Chart Type from the Chart Standard Toolbar on top as follows:
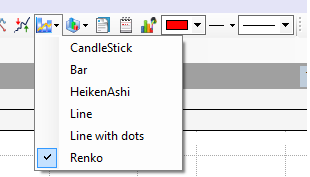
Or Right click on the chart and select Chart Type.
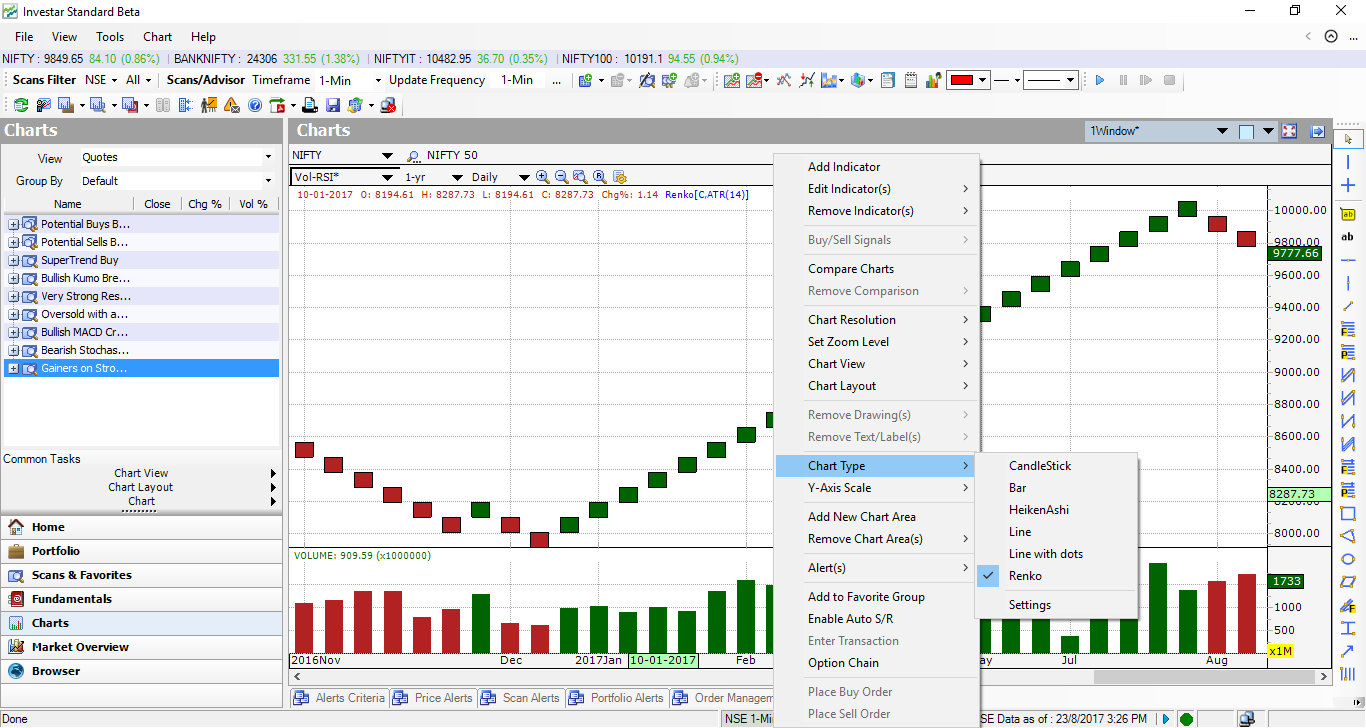
Step 3: Chart of the selected Chart Type will be displayed.
You can also set the parameters of this chart, Simply right click on the chart and select setting option for Renko
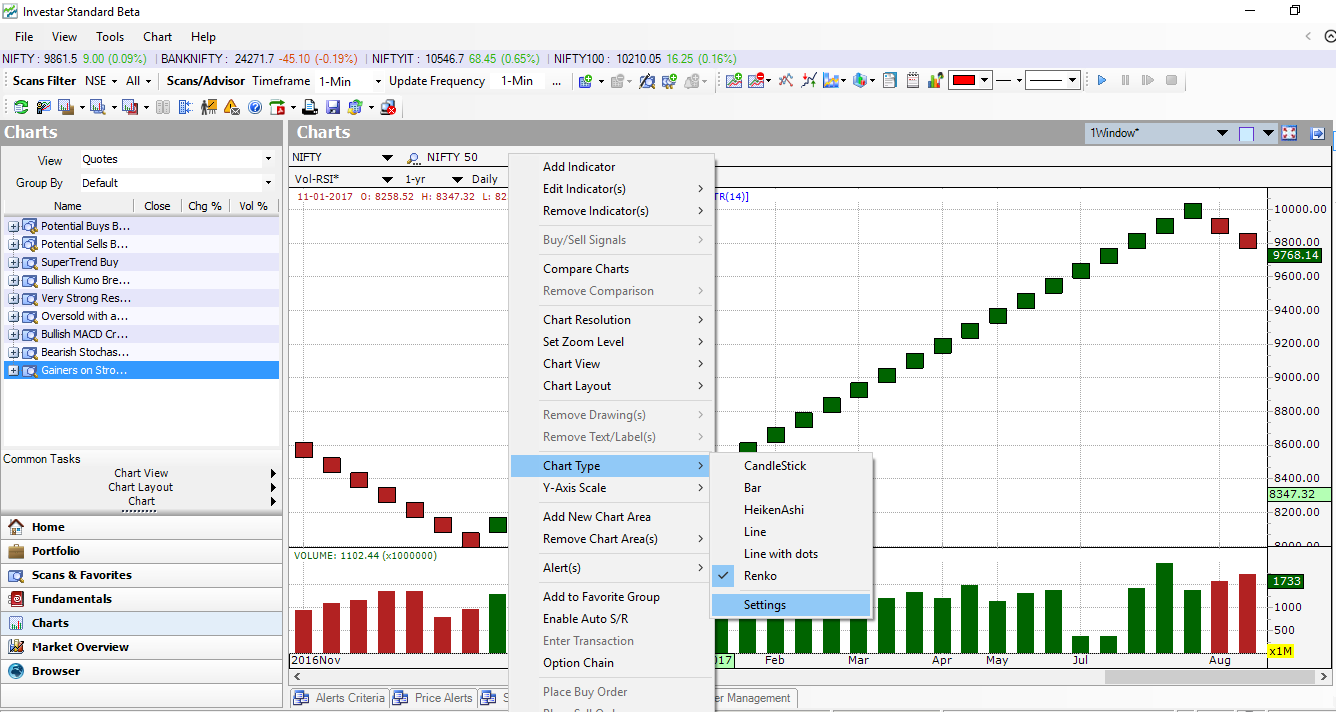
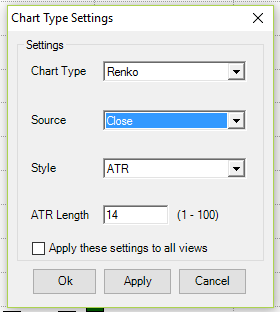
You’ll notice some variables or setting for Renko you can alter, You can see this video for a detailed explanation for all these parameters/settings.
How Renko Charts are constructed
Most renko brick size can be calculated in two ways – using ATR or using the user’s predefined value for the size of the brick (also called Traditional).
Average True Range (ATR) – Uses the values generated by the Average True Range (ATR) indicator. The ATR is used to filter out the normal noise or volatility of a financial instrument. The ATR technique “automatically” determines a good brick size. It computes exactly what the ATR value would be on a regular candlestick chart and then makes this value the brick size. The Renko charting is typically configured to a 14-period ATR (Average True Range). The brick size is based on the ATR value at the time the chart is created.
Traditional – Uses a user-pre-defined absolute value for brick size. New bricks are merely created when price movement is at least as large as the pre-determined brick size. The upside to this method is that it is very straightforward and it is easy to anticipate when and where new bricks will form. The downside is that selecting the correct brick size for a specific instrument will take some trial.
Benefits of Renko Charts
- Renko charts can eliminate noise. Renko charts are made of similar sized bricks touching one another, and it is much easier to see a trend or pattern form.
- Because Renko charts filter out the noise, conducting technical analysis is a lot simpler. This also means that it represents trends very smoothly.
- May be able to easily indicate support and resistance
With Investar Chart Layout feature you can simply see any scrip using any chart type to compare how they look in different chart types. All you do is create two different Chart Views and save them in a Chart Layout.
To see this in action, here is a screenshot of Investar with a 4-chart layout showing NIFTY:
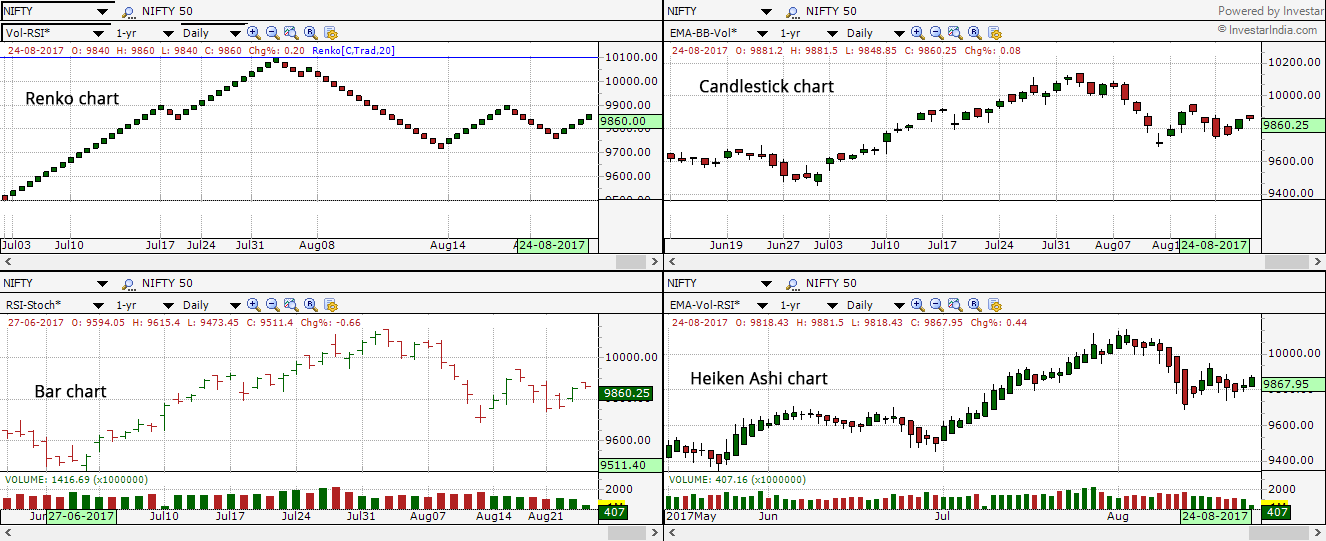
Renko charts filter the noise by concentrating entirely on minimum price changes. Renko bricks are not added unless price changes by a specific amount. As you can see above, it is easy to detect important highs and lows and identify key support and resistance levels.
This is very interesting, can it be able to install the Renko chart on my mobile phone … and if installing in the computer do I need to purchase it first or it is there already in the settings?
his is very interesting, can it be able to install the Renko chart on my mobile phone … and if installing in the computer do I need to purchase it first or it is there already in the settings?
Sir, We had not yet implemented the Renko charts in our Mobile and It is only available in the standard version of Investar. You can contact our support team: +91-97250-10402 for further details