We are proud to add a new feature to the Investar mobile beta app — Industry Ranking with RSR (Relative Strength Ranking) for industries and sectors.
The Industry Ranking feature in Investar Mobile Beta (coming soon in Investar desktop version) allows you to screen first by industries/sectors to find the industries/sectors that are performing the best and then for stocks within those industries so that you can invest in the stocks with the best performance.
How to get the new version?
You may download the mobile application directly by typing the following URL into your mobile browser:
What is an Industry?
An industry is a group of companies that are related based on their primary business activities. Individual companies are generally classified into an industry based on their largest sources of revenue.
Let’s see an example to have a more clear understanding. While an automobile manufacturer might have a financing division that contributes 10% to the overall revenues, the company would be classified in the automaker industry by most classified systems.
Why Industry Ranking?
A certain form of a ranking system is important for stocks and industries so that investors can decide better which stocks they want to invest in.
How are Industries or Sectors ranked?
One of the most popular ways to rank industries is by the Relative Strength Ranking (RSR), which basically takes the ratios of the industry Index vs the Nifty to see its performance over pre-decided periods of time, like 12-months, 6-months, 3-months, 1-month.
Higher RSR indicates that the industry/sector is performing better than Industry with lower RSR.
Other information like EPS-Gr%, Sales-Gr%, PE, PEG is also available for further analysis.
For example, RSR will be given as %ile from 1 to 100. A percentile of 90 means that the particular industry is performing better than 90% of industries (or in case of a stock, it is performing better than 90% of stocks). All stocks are ranked relative to all other stocks by comparing their performance with respect to Nifty.
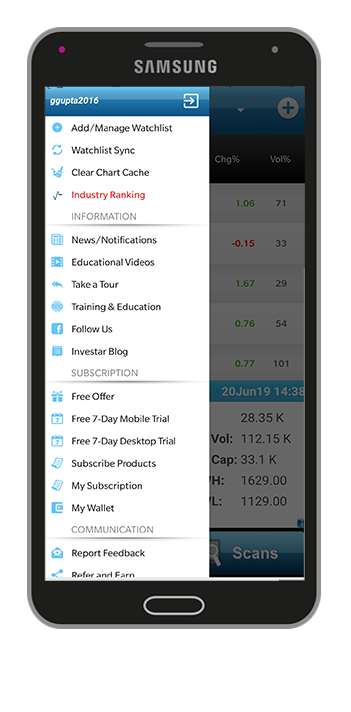
How to view Industry Ranking in Investar Mobile App:
Goto Menu of Investar app and click on Menu and select Industry Ranking
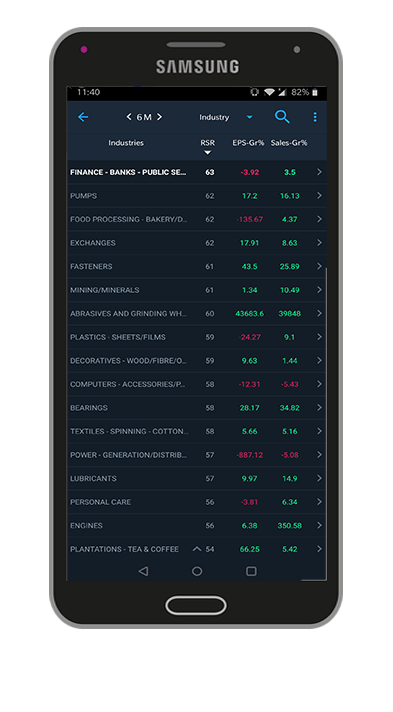
After clicking on Industry Ranking you will see a screen as shown below, where you can see a list of industries sorted according to RSR (or any other ratios).
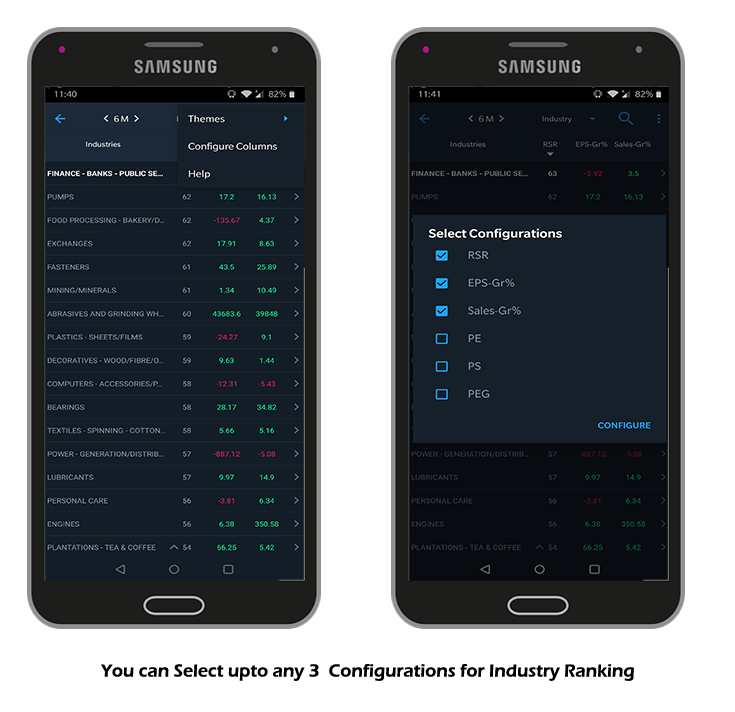
You can also change the configuration settings for Industry Ranking, to do so you just have to click on the upper right-hand side corner as shown in the below image:
About the Other Ratios
As you have seen in the above screenshot that there are other ratios on the basis of which you can also sort industries and stocks. Let us understand what each and every ratio means:
EPS-Gr% – Earnings per share or EPS is an important financial measure, which indicates the profitability of a company.
It helps to determine the profitability of a company before buying its shares. EPS growth illustrates the growth of earnings per share of Trailing Twelve Months (TTM) over the previous TTM. The higher the %EPS Growth, the higher the stock can appreciate over time if it is priced right.
Sales-Gr% – Sales growth shows the increase in sales over a specific period of time – this is important because, as in investor, you want to know that the demand for a company’s product or service will increase in the future, and higher sales growth often results in more profit growth.
PE Ratio – Price to Earnings ratio (P/E ratio) is the ratio for valuing a company that measures its current share price relative to its per-share earnings(EPS).
PS Ratio – The price-to-sales (PS ratio) is a valuation ratio that compares a company’s market capitalization to its revenues (or alternatively price compared to its sales per share).
The ratio shows how much investors are willing to pay per Rupee of sales. PS Ratio is the most relevant when used to compare companies in the same sector.
PEG Ratio – The price/earnings to growth ratio (PEG ratio) is a stock’s price-to-earnings (P/E) ratio divided by the growth rate of its earnings for a specified time period.
The PEG ratio is used to determine a stock’s value while also factoring in the company’s expected earnings growth and is thought to provide a more complete picture than the P/E ratio.
You can also select any Industry and you’ll see the number of stocks contained in the Industry Group with their particular measure and how they had performed over the period. The number of stocks contained within each sector can be represented on the charts also.
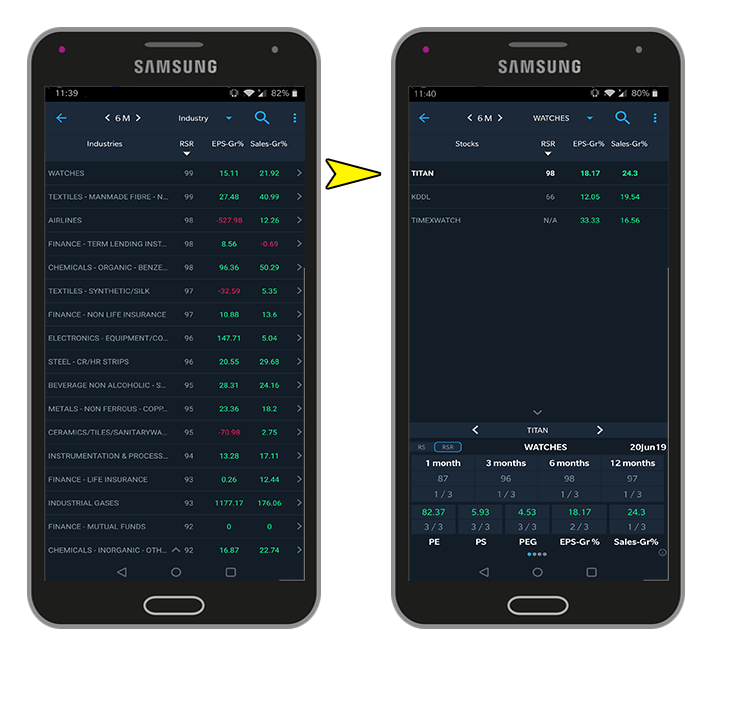
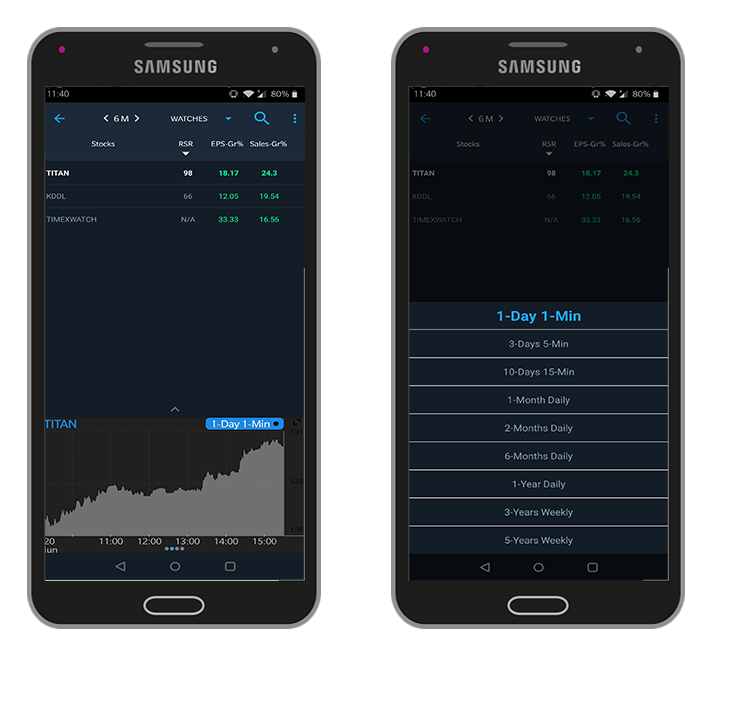
As you can see in the above screen that after selecting TITAN stock we were able to see all the details such as its RSR ranking in past 1-month, 3-months and so on, PE ratios, PS ratio of the stock, etc.,
To view the chart of a particular stock within the Industry group, simply select any stock and you can see the chart from 1 day to 5-year chart.
How to get the new version?
You may download the mobile beta application directly by typing the following URL into your mobile browser: