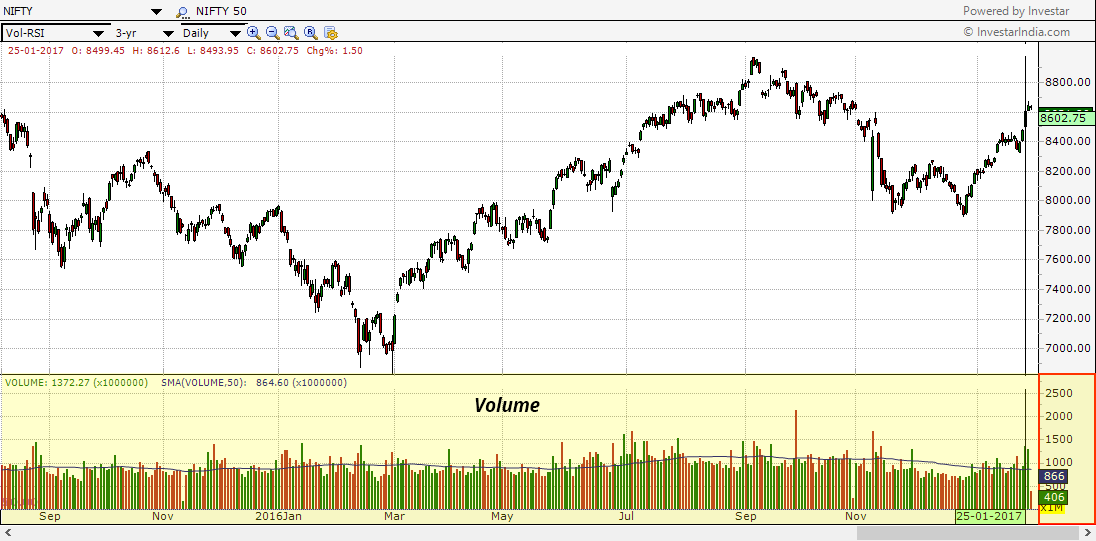
Volume is among the most basic and effective concepts to understand when trading stocks. Volume is actually the number of shares (or contracts) that trade over a certain period of time (e.g.a day for daily timeframe). The higher the volume, more active the shares. Volume plays a significant role in the buying and selling of the stocks. Most traders combine the volume with the price of the stock to take the trading decision.
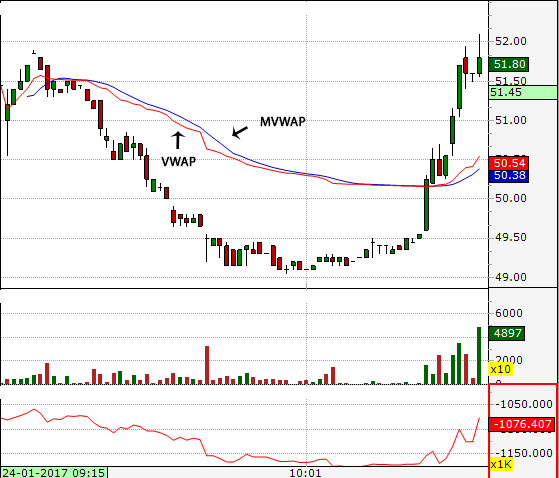
Volume bars visualise the amount of shares that have traded per time period and show trends in the same manner that prices do and can be usually found at the bottom of any chart.
The most significant rule is this: volume precedes price. Generally, before a stock price moves, the volume comes into play. This is explained in detail in the next section.
Price & Volume Patterns
Price & Volume Trends can be together used to confirm the strength of price movement.
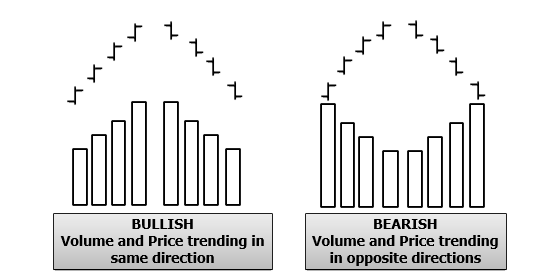
- Increasing price along with increasing volume, confirms the uptrend and is a healthy sign of a strong uptrend and hence is Bullish.
- Decreasing price along with decreasing volume is Bullish because it indicates weak retail investors are selling and hence is not a reason to worry. This is probably a good thing because once the consolidation happens, the breakouts will be much stronger.
- Decreasing price along with increasing volume indicates that the big guys are selling and hence is Bearish.
- Increasing price along with decreasing volume indicates weak retail investors are buying and is a cautionary sign and should make you doubt the upward price movement (i.e. it is Bearish).
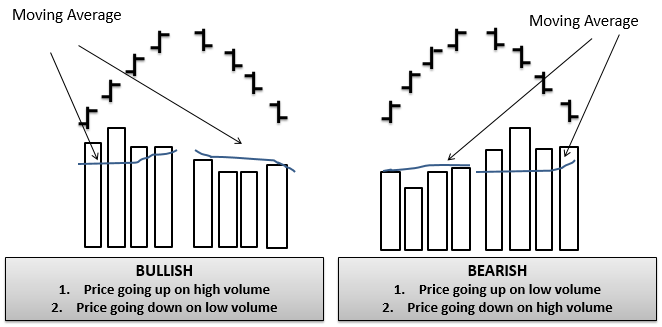
But it is not always possible to have exact bullish/bearish pattern as shown in above figures. In fact, what is important is that the price movement should happen on high volume, and this can be done by ensuring that the volume is above the 50-day moving average. Any sign that volume is above the 50-day SMA indicates accumulation and vice versa below the 50-day SMA indicates distribution.
In Investar, we colour the volume bars depending on the %Chg (i.e. how much the stock has moved up/down compared to previous day’s close). We do this to help a trader identify precisely such price and volume patterns.
In Investar, colour of volume bars
- Green bars – stock closed up
- Red bars – stock closed down
Volume and Breakouts
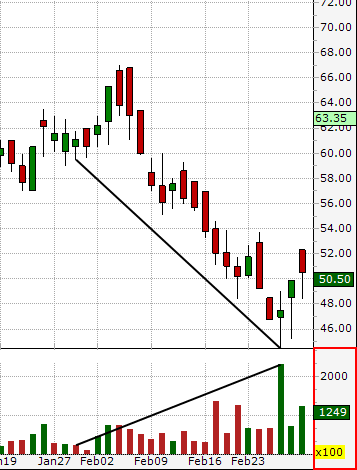
Volume can help to verify all sorts of breakouts. A stock is said to break out on strong volume, when a strong resistance is broken on high volume. A breakout taking place on rising volume is a valid breakout, while a breakout with low volume is more likely to be false.
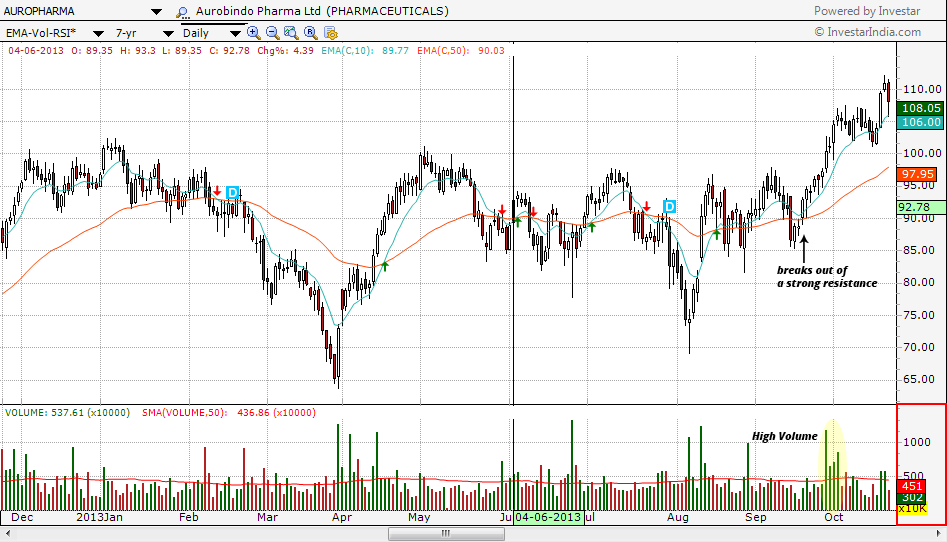
When a stock breaks out of a strong resistance on high volume, it is a great entry point and if used properly can help in identifying multi-baggers. One of the important factors to look for in such a stock are the bullish price and volume patterns, before the breakout and at the time of the breakout.
It so happens that one of the biggest multi-baggers in recent times, AUROPHARMA, exhibited all these properties as is shown in the chart.
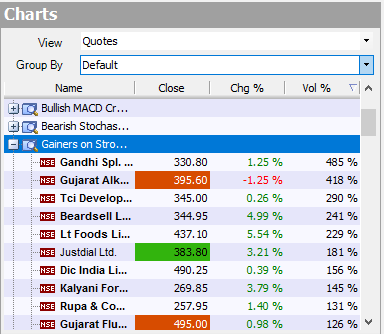
In Investar we also provide Vol% data in the Navigation Pane – see below (i.e. volume expressed as a % of the 50-day avg volume), so that you can easily view which scrips has gone up or down on high volume.
Please refer How to identify Good Volume Breakouts on our blog for more details about this strategy.
Stock Volume and Price Divergence
Divergence occurs when price movement is not confirmed by the indicator. There are two kinds of Indicator Divergence: Negative Divergence and Positive Divergence. In many cases, these divergences can indicate a potential reversal.
Figure 1 shows Divergence. The volume gradually increases as the price declines.
Declining volume in the course of an uptrend illustrates that interest is decreasing. Price can still continue to rise on declining volume, though. Declining volume foreshadows an eventual reversal, but shouldn’t be acted upon until the price actually breaks the uptrend.
Declining volume during a downtrend doesn’t tell us a lot because a lack of interest can either indicate a lack of buying interest, which continues to push the price lower, or a lack of selling interest, which could eventually push the price higher.
Volume and Price Reversals
Volume spikes are often the result of news driven events, it indicates that buyers or sellers may be exhausted. At the point when the volume spike happens after a run brings down in price, it demonstrates sellers could soon be depleted, and without any sellers left to push the price down, the price will rise. At the point when the volume spike happens after a run higher in price, it demonstrates buyers could soon be depleted, and without any buyers left to push the price up, the price will drop. This volume spike will often prompt to distinctive reversals since the moves are unsustainable due to the imbalance of supply and demand.
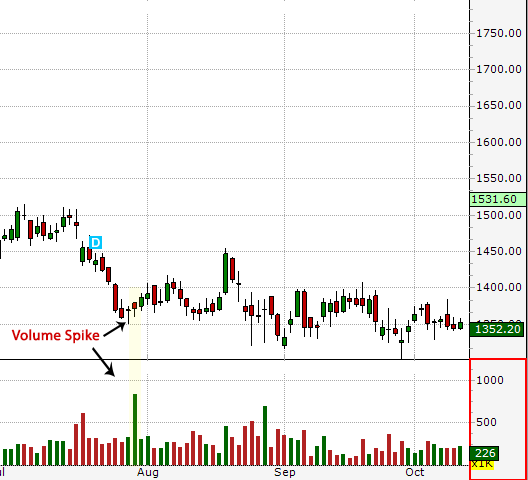
Above figure: A RENUKA daily chart showing increasing volume on the breakout.
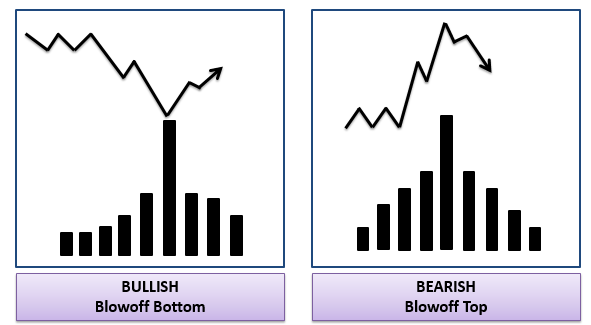
Blow-Off Tops and Bottoms
Blow-Off Tops and Bottoms are usually contrary to the price volume patterns indicated above . e.g. a Blow-Off top is a chart pattern that indicates a steep and rapid increase in a stock’s price on high trading volume followed by a steep and rapid drop in price and volume is referred to as a Blow-Off Top.
Blow-Off Tops are usually formed at the tail end of long-term uptrends and are a sign that the overall market is peaking. They are caused by the sudden rush of small investors to get into the stock. In fact towards the end of long-term uptrends, a lot of the stocks will exhibit such behavior, so if you notice such behavior in many stocks, that is a sign that the overall bull market is about to end. E.g., in Jan 2008, when the SENSEX peaked at 21000, a lot of stocks exhibited this pattern.
Similarly, Blow-Off Bottoms usually happen at the tail end of long-term bear markets and usually indicate that the bear market is going to end. A Blow-Off Bottom is caused by panic selling causing the stock to go down in a steep downtrend on very high volume, after which the stock starts going up.
The Bottom Line
A volume is a significant tool because it shows the conviction of buyers and sellers. Volume should never be used independently of price action to determine to buy or to sell patterns, but it is an invaluable tool to gain insight into the markets and determine the current price trend.